

Solar Battery Payback: How to Calculate ROI in Australia
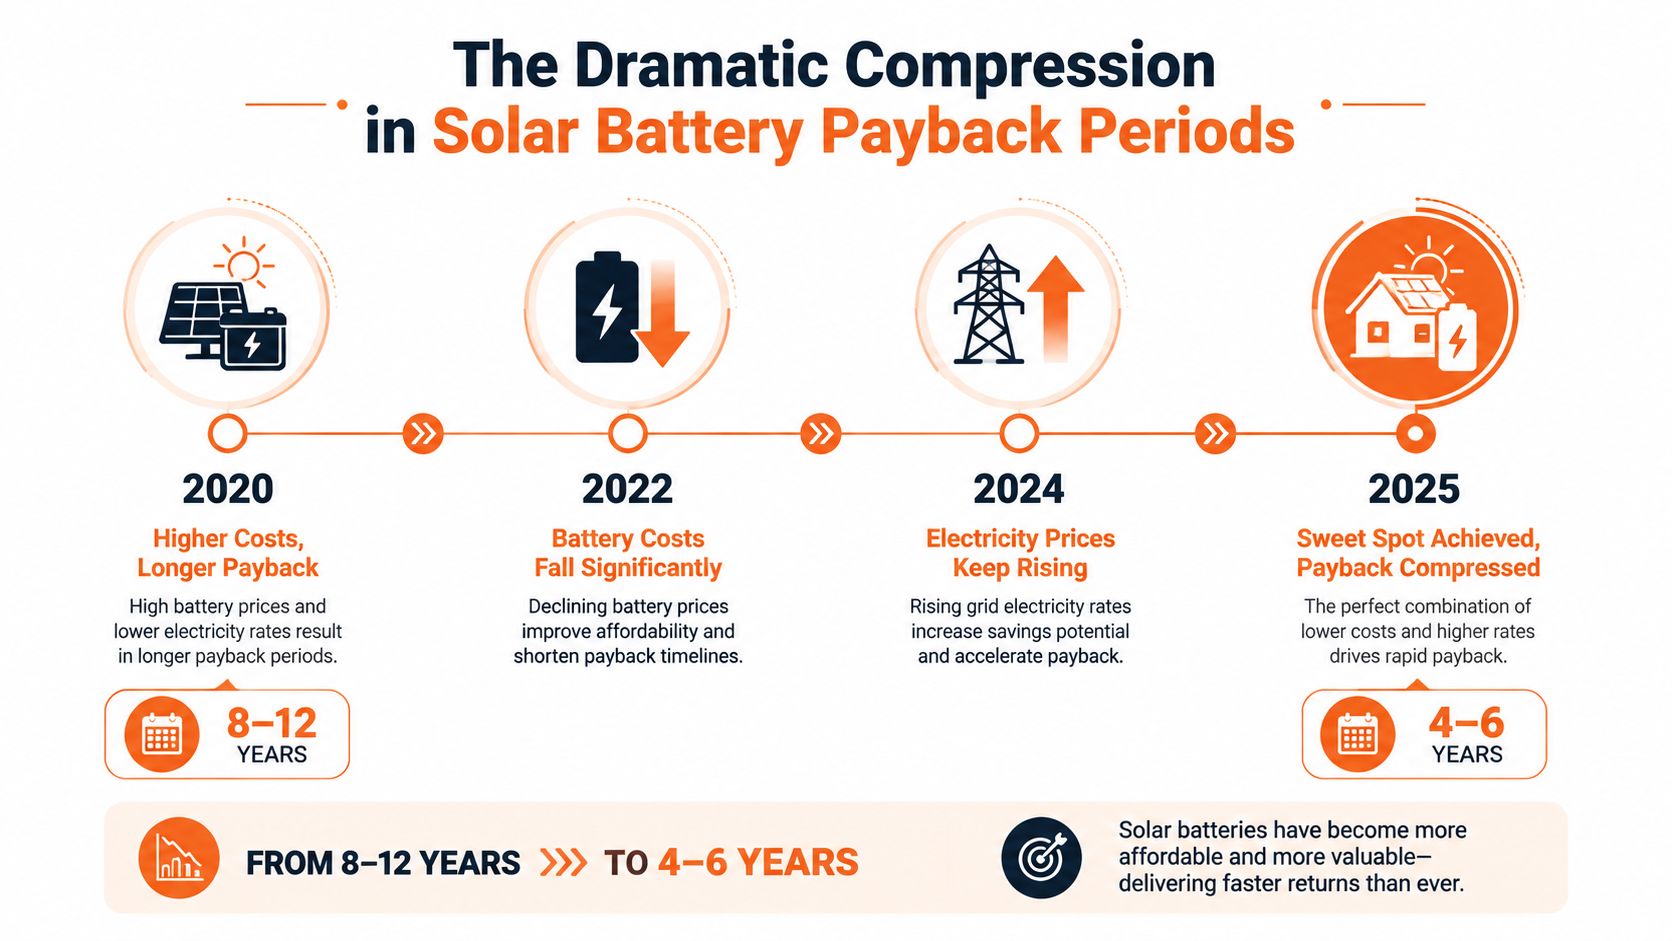
A typical Australian residential battery's payback period fell from 19.05 years in 2016 to 10.11 years in 2022, with a projected 7.47 years in 2025, according to the Australian Energy Market Commission's battery analysis. That change reframes solar battery payback. It's no longer a fixed five-to-ten-year slogan. It's a calculation shaped by your location, tariff, usable capacity, consumption profile, rebate timing, battery cycling and access to Virtual Power Plant revenue.
For households in New South Wales and Queensland, the question isn't whether a battery can store excess solar. The commercial question is whether the system can repeatedly replace expensive imports, avoid low-value exports and earn additional value from spare capacity without compromising household use.
Why Solar Battery Payback Has Become a Realistic Investment
Battery economics have changed materially, but the improvement hasn't come from one factor. The AEMC model shows installed cost falling from $10,349 in 2016 to $8,491 in 2022 and 2025, while the net incentive increased from $0.20 per kWh to $0.24 per kWh in 2022 and $0.30 per kWh in the projected 2025 model. The same analysis records average battery life improving from 8.35 years in 2016 to 9.79 years in 2022 and 2025. These figures are set out in the AEMC residential battery investment analysis.
The important threshold is whether the battery can repay its cost within its useful operating life. Under the AEMC assumptions, a battery needs to pay back within 9.7 years to be considered cost-effective. The projected 7.47-year benchmark therefore moves the typical model from clearly uneconomic towards a more credible investment case.
Payback is local, not national
National averages conceal the differences between homes. A published Australian scenario guide lists a payback period of 6.7 years in NSW and 7.0 years in Queensland for a new solar and battery system, with corresponding ROI estimates of 14.9% and 14.3%. Its battery-only scenarios list 6.8 years for Brisbane and 7.1 years for Adelaide, while Canberra is slower at 8.6 years. Those figures appear in Solar Choice's Australian battery payback analysis.
The reason is straightforward. A battery creates value when it stores electricity that would otherwise be exported at a relatively low feed-in tariff, then supplies the home when electricity imports cost more. The size of that gap depends on the retail plan, network conditions, household demand and the timing of solar generation.
Practical rule: A battery's headline payback is only a starting point. Your hourly load profile determines whether the battery can capture the value assumed by the model.
A home with evening cooking, heating, hot water or electric vehicle charging may use stored energy consistently. A lightly occupied home with modest overnight demand may leave much of its capacity unused. The same battery can therefore represent a sound investment for one NSW or Queensland household and a poor fit for another.
Timing matters too. Policy support has helped compress payback, but incentives are changing. A calculation made before an installation date may not apply afterwards, particularly for larger systems affected by the federal rebate changes scheduled for 1 May 2026.
The Key Inputs That Determine Your Payback Period
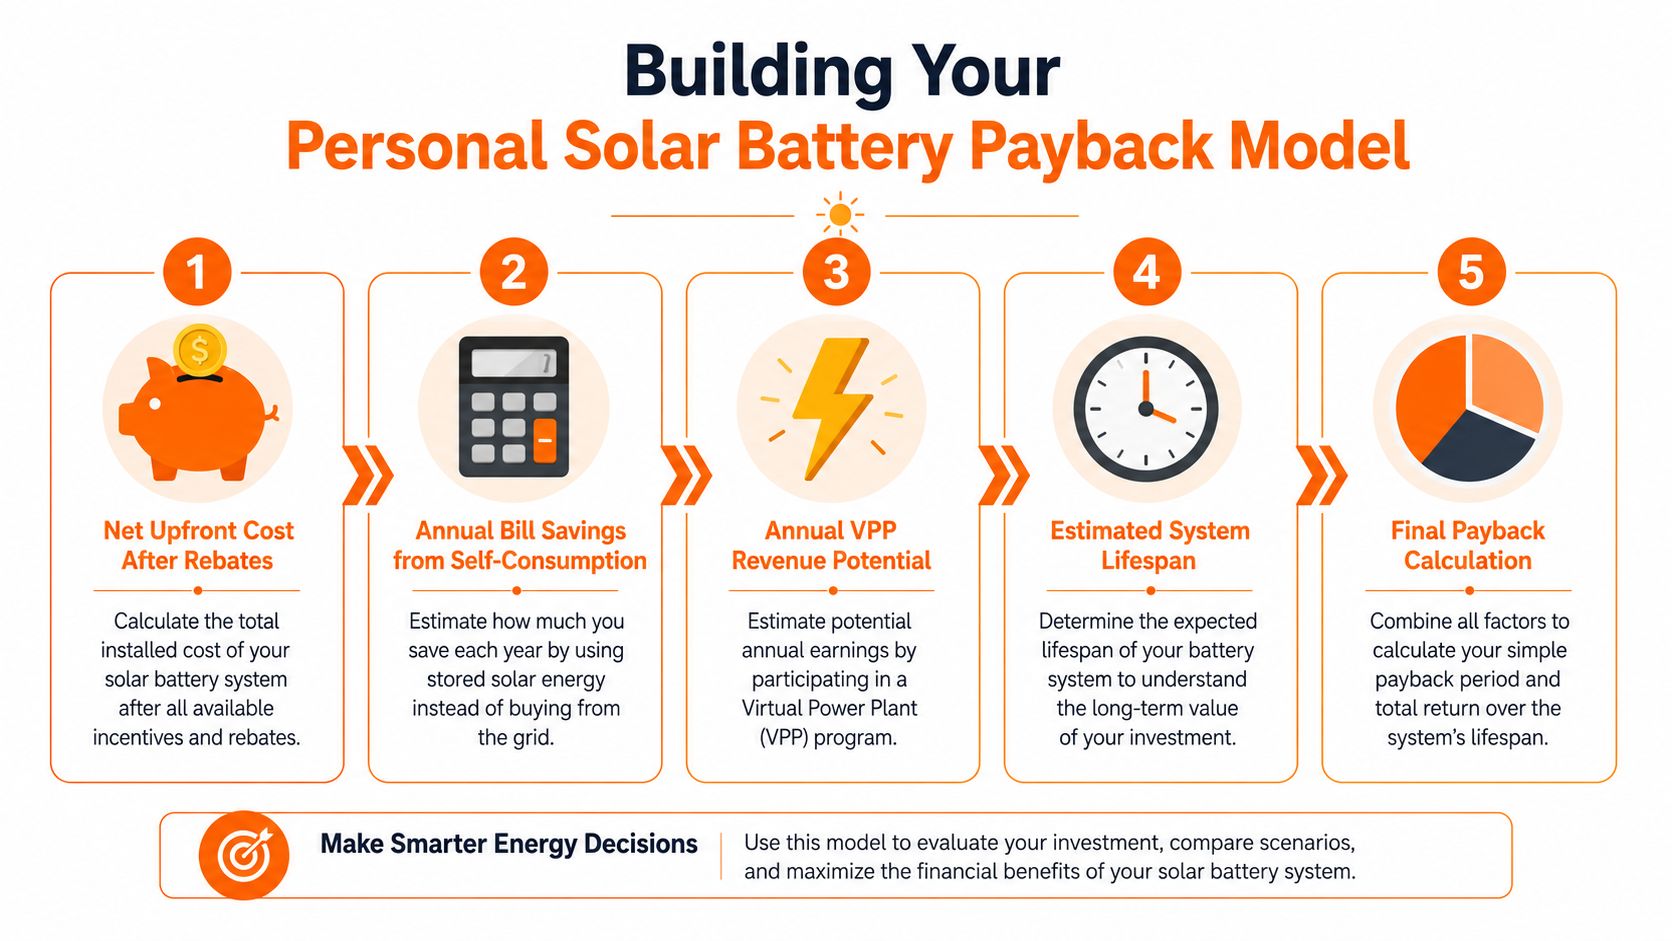
Simple payback is usually expressed as:
Net upfront cost after incentive ÷ annual financial benefit = payback period
That formula is easy. Producing credible inputs is harder. The Australian guidance on solar battery rebate calculations recommends testing the result against state-specific consumption and feed-in tariff assumptions rather than relying on a generic annual average.
Start with the cost you actually pay
Use the installed system price after the applicable federal battery incentive, not the battery's advertised price. Include installation, compatible inverter or control equipment and any electrical work that forms part of the project. A lower sticker price doesn't necessarily create a faster return if the system has limited usable capacity or poor control over charging and discharge.
The rebate is only one part of the calculation. Its timing and structure can change the net cost, which is why a quote should record the expected incentive, installation date and usable capacity separately.
Model usable energy, not nameplate capacity
A battery's advertised capacity isn't necessarily the amount available for daily household use. Your model should account for usable kWh, depth of discharge and round-trip efficiency. Round-trip efficiency measures how much energy remains available after charging and discharging losses.
The High Flow Energy round-trip efficiency guide explains why the energy entering a battery and the energy later delivered to the home aren't identical. Ignoring this difference inflates expected savings.
Calculate self-consumption from hourly behaviour
Annual electricity use can't show when the battery will cycle. Compare daytime solar generation with evening and overnight demand. In NSW and Queensland, a home with substantial existing rooftop solar and material overnight consumption is more likely to benefit because the battery can shift energy into periods when grid imports carry greater value. SolarQuotes' battery payback guidance makes the same practical distinction between suitable load profiles and oversized systems.
Your model should test:
- Solar surplus: How much daytime generation remains after immediate household use?
- Night demand: How much stored energy can the home absorb before the next solar charging window?
- Tariff spread: What import cost is avoided, and what export income is forgone?
- Cycling frequency: Will the battery regularly charge and discharge, or sit partly full?
- Degradation: How might declining usable capacity affect later-year savings?
A battery sized for backup resilience may not be sized for arbitrage value. If it rarely empties, its annual benefit can be lower than the headline capacity suggests. That's why a good payback model uses interval data, tariff schedules and battery operating limits rather than multiplying battery capacity by an assumed number of cycles.
How the May 2026 Federal Rebate Changes Affect Your Numbers
The federal Cheaper Home Batteries Program changes on 1 May 2026. The STC factor falls from 8.4 to 6.8, and the incentive uses a tiered structure based on usable capacity. The Clean Energy Regulator's announcement states that capacity from 0 to 14 kWh receives 100% of the factor, capacity from 14 to 28 kWh receives 60%, and capacity from 28 to 50 kWh receives 15%.
This creates a rebate cliff for larger systems. A battery within the first tier is treated differently from the portion of a larger battery that exceeds that threshold. A 15 kWh system therefore doesn't receive the same incentive treatment across all usable capacity as a smaller system. The financial impact depends on the eligible certificate value and the installed price, so homeowners should request a post-change calculation rather than apply an old rebate estimate.
Independent coverage describes the rebate as reducing upfront cost by roughly 30%, with the indicative value stepping down from about $311 per usable kWh earlier in 2026 to about $252 from 1 May 2026. Those figures and the timing are reported by the Clean Energy Regulator in its rebate update. Because the figures are policy-dependent, they shouldn't be treated as a permanent battery discount.
Size the battery for value, not just security
Backup capability can be important, particularly in areas exposed to outages. But backup value and payback value are different calculations. A larger system may provide more resilience while cycling less often, which can lengthen financial payback if the additional capacity doesn't regularly displace imports or support valuable grid events.
A sound comparison should test the smallest system that meets the household's regular evening demand against a larger system chosen for backup. It should then show the effect of the rebate tiers, expected cycling and any VPP participation. Homeowners comparing energy policy with other household electrification decisions may also find this electric vehicle incentive guide useful for understanding how government incentives can alter purchase timing.
For background on the battery program and its broader policy purpose, High Flow Energy's Australian solar battery rebate resource provides additional context. The policy is intended to sustain the program to 2030 and support around 40 gigawatt hours of storage capacity, according to ABC News' coverage of the rebate change.
Self-Consumption Versus VPP Revenue as Payback Drivers
A battery's payback depends on how many value streams it can access. In the traditional model, rooftop solar charges the battery during the day, then the stored energy supplies household demand after production falls. The financial return comes from avoiding grid imports and using surplus solar at home instead of exporting it at a low feed-in tariff.
A VPP adds a second operating objective. It coordinates participating batteries to respond to wholesale price movements, demand events and grid-support requirements. For a homeowner, spare capacity can generate value beyond self-consumption, provided the program protects household priorities and stays within network, inverter and battery limits.
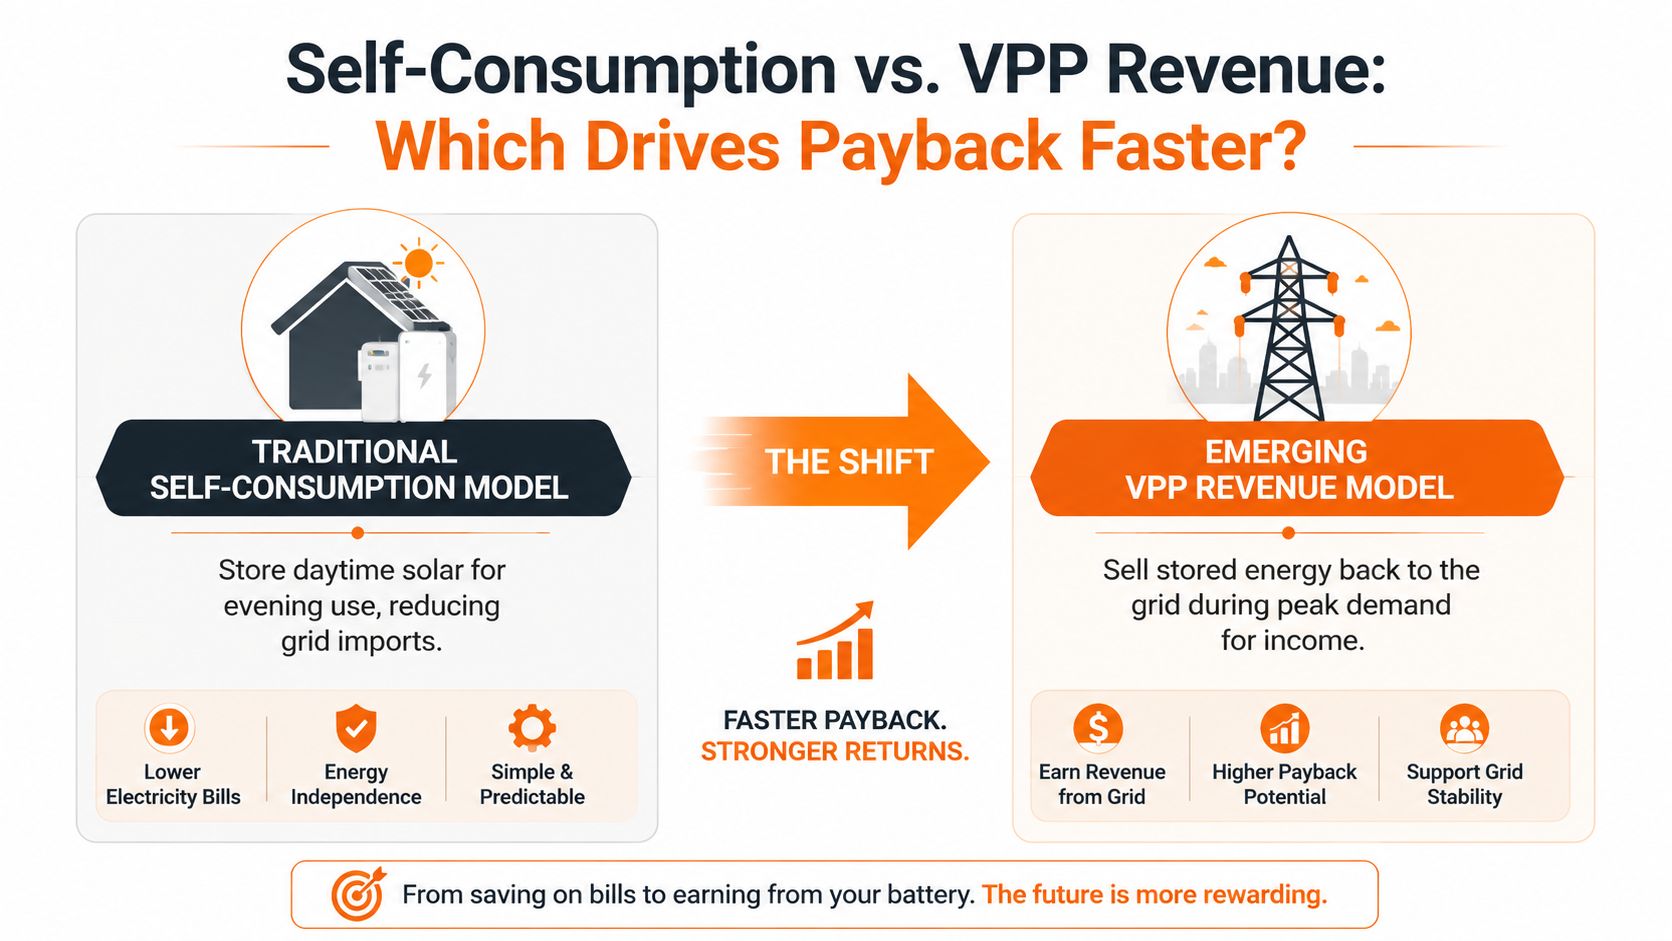
Two operating models, different value capture
| Feature | Self-consumption model | VPP-optimised model |
|---|---|---|
| Primary purpose | Store solar for later household use | Combine household use with coordinated grid services |
| Battery dispatch | Follows household demand and solar output | Responds to household demand, market conditions and approved events |
| Export strategy | Often exports surplus when the battery is full | Can preserve or discharge energy when grid value is higher |
| Revenue sources | Avoided imports and feed-in income | Avoided imports plus eligible grid-service or allowance value |
| Main risk | Battery may sit underused | Poor controls or unclear terms may reduce household access |
Falling feed-in tariffs increase the value of using solar after sunset. A battery owner may benefit from storing daytime surplus for household demand, or from allowing an approved VPP to dispatch capacity during a demand event. The result varies by contract. Allowance structure, dispatch rules, retailer arrangements, network charges and battery limits all affect the payback calculation.
The difference is particularly important for existing battery owners. Their installation cost is already sunk, so the relevant question is whether VPP income can improve utilisation without creating unacceptable cycling, warranty or backup trade-offs. For a new buyer, VPP revenue can reduce effective payback time, but it should be modelled as conditional income rather than guaranteed savings.
Retailer-based VPPs may connect the electricity plan, wholesale exposure and battery dispatch through one customer relationship. A third-party aggregator can coordinate the battery while another retailer manages the bill. Either arrangement requires clear terms covering priority access, override controls, warranty conditions and the method used to calculate allowances or payments.
A battery that only avoids household imports has one value stream. A battery that also responds safely to market and grid conditions has more opportunities to earn its keep.
HighFlow Energy's explanation of multiple battery revenue streams shows how additional income can affect the financial model when spare capacity would otherwise remain idle.
The operating distinction is demonstrated in the following explainer:
Three Worked Payback Scenarios for Australian Households
A worked model is useful only when its assumptions are visible. The table below uses illustrative scenarios, not market quotations or predictions. The upfront costs and annual savings are deliberately shown as variables so readers can insert their own post-rebate quote, interval consumption and tariff results.
| Scenario | Upfront Cost | Annual Savings | Payback Period | VPP Impact |
|---|---|---|---|---|
| NSW family home, self-consumption only | Net installed cost after applicable incentive | Avoided imports plus displaced exports | Net cost divided by annual bill benefit | No additional VPP value |
| Queensland household, high overnight load | Net installed cost after applicable incentive | Higher recurring self-consumption benefit | Potentially shorter than the first scenario if cycling is stronger | Additional allowance or grid-service value may shorten effective payback |
| Oversized system, infrequent cycling | Net installed cost after applicable incentive | Lower annual benefit relative to capacity | Longer because the battery is underused | VPP value may improve utilisation, but household and warranty limits still apply |
Scenario one, a moderate evening load
A NSW family with existing rooftop solar may have enough daytime surplus to charge a battery, but its payback depends on whether the home regularly consumes that energy after sunset. If the family's evening demand is modest, the battery may not discharge fully before the next solar window. The correct model should reduce the expected annual benefit rather than assume every available kWh replaces a grid import.
This profile may sit near the NSW scenario benchmark of 6.7 years for a new solar and battery system, but that published figure isn't a promise for an individual home. It assumes a particular combination of tariff, incentive and consumption conditions, as described by Solar Choice's scenario data.
Scenario two, strong overnight demand and VPP participation
A Queensland household with evening cooking, cooling, hot water or vehicle charging can absorb more stored energy. The battery's self-consumption value is stronger because it cycles more consistently, while VPP participation may add an allowance or grid-service return for capacity the household doesn't need at a particular time.
The Queensland benchmark of 7.0 years for a new solar and battery system provides context, but a VPP-optimised model needs to separate bill savings from VPP value. Combining them without showing the individual components makes the calculation difficult to audit.
Scenario three, the oversized battery
An oversized battery can look attractive because it offers greater storage and backup. Financially, however, unused capacity adds cost without necessarily adding equivalent annual savings. SolarQuotes' analysis reports that 11 of 24 scenario comparisons had payback under 8 years, showing that a majority of the configurations in that comparison did not clear that threshold.
The practical conclusion is more important than the range. Choose capacity against regular load first, then test backup requirements and VPP participation separately. A larger system may still be justified, but its resilience benefit shouldn't be presented as bill-saving payback.
How HighFlow Energy Delivers Additional Battery Value
For an existing battery owner, technical operation is only the starting point. The financial question is whether the system captures value at the right times. A battery may charge and discharge correctly while still producing weaker returns because it exports too early, misses high-value demand periods, cycles at unsuitable times or leaves usable capacity idle.
HighFlow Energy's Bring Your Own Battery Virtual Power Plant model is intended for existing solar and compatible battery owners in NSW and Queensland. It coordinates participating batteries for grid services and uses the resulting value to fund a monthly bill-free electricity allowance. That allowance can cover daily supply charges and usage up to its limit, without network and distribution charges on that portion. Consumption above the allowance remains charged at standard rates.
The economic significance is that an existing battery can earn value beyond self-consumption. This matters particularly after the May 2026 rebate change, because owners who already have a system cannot recover the higher upfront support available before the STC factor falls. VPP revenue or bill credits can therefore change the payback calculation without replacing the battery.
What the customer keeps
The model gives household use priority rather than providing unrestricted access to the battery. Customers retain ownership and priority use of stored energy. The service requires no new hardware, has no lock-in contracts and no exit fees. A companion app displays live prices, forecasts and savings, helping customers assess whether automated dispatch is improving the result.
AI-driven charge and discharge plans can adjust battery operation to household demand and grid conditions. Customers can override those plans, preserving practical control when household needs differ from the automated schedule. That control also matters for households with changing evening loads, backup preferences or higher-than-usual demand.
Warranty protection requires specific review. A VPP should operate within the battery manufacturer's approved limits and explain how dispatch affects warranty conditions. Customers should check those terms before joining, along with eligibility requirements, backup reserves and any rules governing the battery's available capacity.
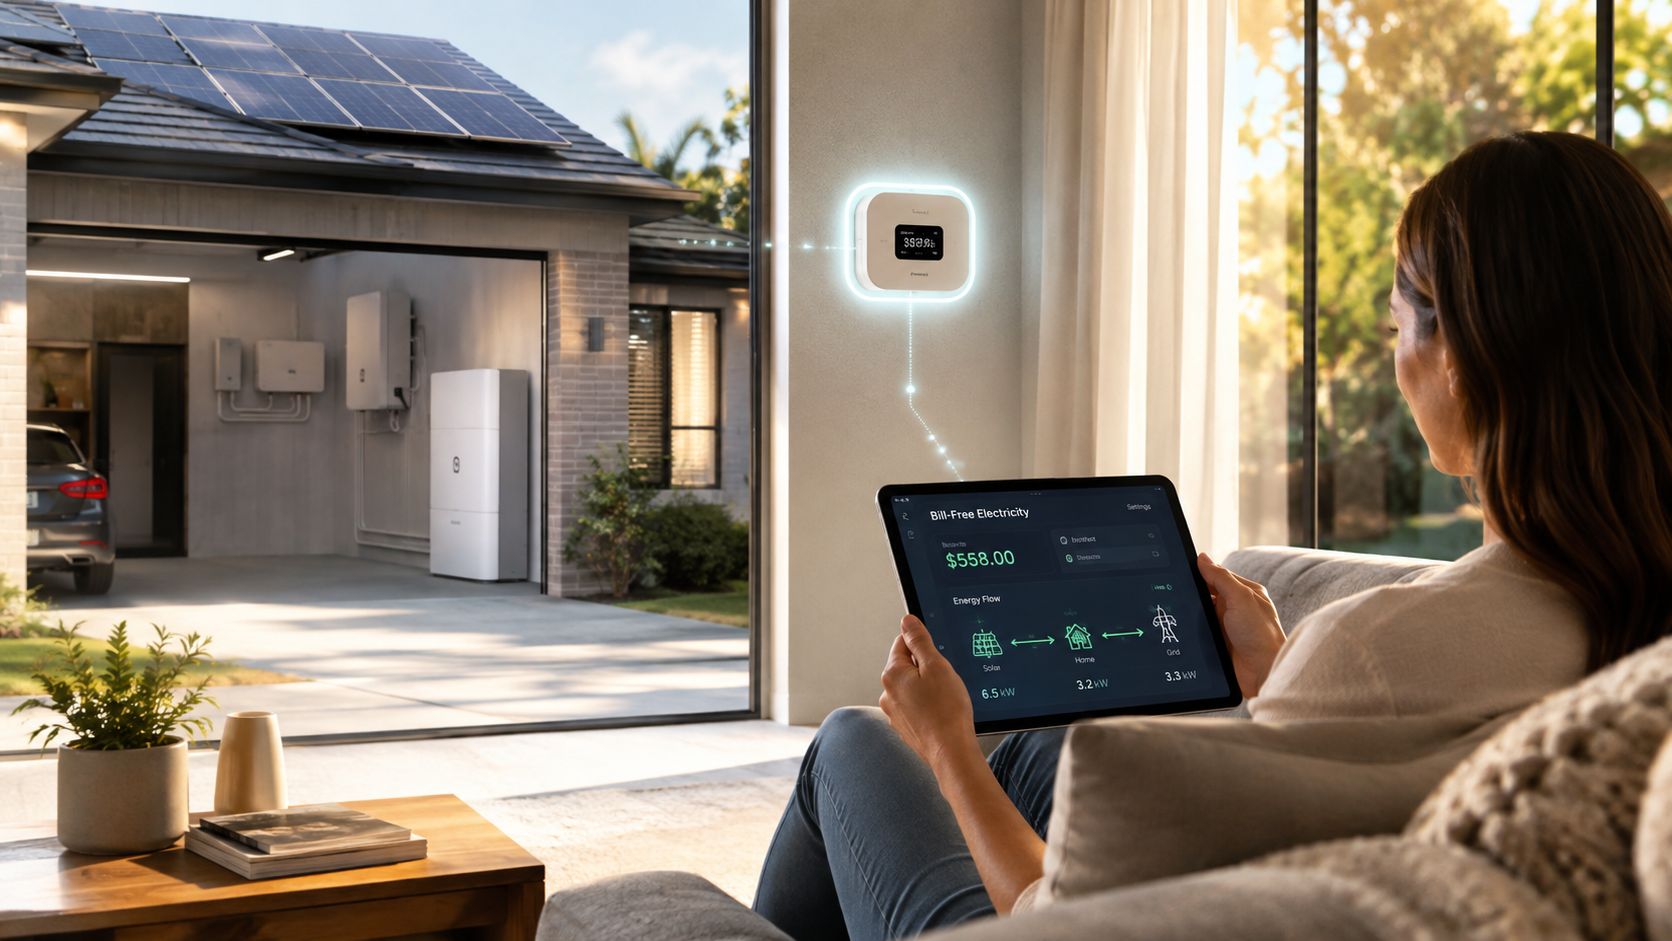
Decision test: If your battery regularly has spare capacity after household needs are met, a VPP assessment can identify value that a self-consumption-only calculation excludes.
Installation quality affects reliability, but ongoing operation determines whether the system performs financially. High Flow Energy is an electricity retailer focused on using existing solar and battery capacity through coordinated operation. Homeowners who want to test whether their battery is underperforming financially can request an eligibility assessment by visiting HighFlow Energy.
Key takeaways
- Solar battery payback has improved: The AEMC records a shift from 19.05 years in 2016 to a projected 7.47 years in 2025 under its assumptions.
- Location changes the result: Published scenarios show 6.7 years in NSW and 7.0 years in Queensland for new solar and battery systems.
- Hourly consumption matters: Usable capacity, overnight demand, depth of discharge and round-trip efficiency determine how much value the battery can deliver.
- The May 2026 rebate changes matter: The STC factor falls from 8.4 to 6.8, with tiered treatment by usable capacity.
- Oversizing can weaken returns: Capacity that rarely cycles adds cost without necessarily adding equivalent bill savings.
- VPP participation changes the model: Grid-service value and allowance structures can create an additional return from spare capacity, which is especially relevant to existing owners facing no opportunity to reclaim the earlier rebate level.
- Transparency is necessary: Check household priority, override controls, warranty treatment, fees, contract terms and retailer authorisation before joining a program.
Frequently asked questions
What is solar battery payback?
Solar battery payback is the time required for a battery's financial benefits to equal its net installed cost. A simple calculation divides upfront cost after incentives by annual bill savings. A stronger model also accounts for export displacement, battery efficiency, degradation, tariff changes and VPP value.
What is the typical battery payback period in Australia?
The AEMC reported a typical modelled payback of 19.05 years in 2016, 10.11 years in 2022 and a projected 7.47 years in 2025. Published state scenarios list 6.7 years in NSW and 7.0 years in Queensland for a new solar and battery system, although individual results vary with tariffs, incentives and household demand.
Do NSW and Queensland households have favourable battery economics?
They can. Existing solar, substantial evening or overnight consumption, meaningful tariff spreads and relatively low feed-in tariffs can improve the result. The state alone does not determine whether a battery is economical. NSW and Queensland households still need to compare their actual import and export prices, load profile and battery utilisation.
How does the May 2026 rebate change affect battery sizing?
From 1 May 2026, the STC factor falls from 8.4 to 6.8, with 0 to 14 kWh receiving the full factor, 14 to 28 kWh receiving 60%, and 28 to 50 kWh receiving 15%. Larger systems therefore require a post-change calculation that tests whether the extra capacity will cycle often enough to justify its cost.
Can a VPP shorten battery payback?
It can improve the effective financial result by creating value from approved grid services or export timing, in addition to household bill savings. The result depends on the allowance or payment structure, dispatch rules, household priority and battery eligibility. Existing owners should compare this incremental value with the savings their battery already produces through self-consumption.
Does a VPP control all of my battery?
That depends on the provider's terms. A suitable program should state when dispatch can occur, how much energy remains reserved for household use, whether customers can override automated plans and how warranty requirements are protected. Those conditions determine whether the program's revenue comes with an acceptable reduction in control.
Is a larger battery always better?
No. A larger battery may provide more backup resilience, but it can cycle less frequently when household demand and solar surplus do not support regular use. Financial sizing should begin with usable capacity matched to recurring evening and overnight demand, then assess backup and VPP requirements separately.
What should I check before comparing VPP retailers?
Compare the electricity allowance or payment method, household priority, network and distribution charge treatment, export arrangements, retailer authorisation, warranty position, contract length, exit terms, app controls and the way battery performance is reported. The comparison should separate ordinary bill savings from VPP-derived value, because combining them can make the payback calculation difficult to audit.