

Electricity Price Chart for NSW and Queensland
Electricity costs in Australia rose 33.9% in the 12 months to September 2025, a movement the Australian Bureau of Statistics attributes largely to government rebates ending and July price reviews. Put that headline beside a wholesale price chart and the confusion starts. They are measuring different things, over different periods, for different purposes.
An electricity price chart in Australia can show a regional dispatch price in dollars per megawatt-hour, a retail tariff in cents per kilowatt-hour, or a bill in dollars per month. Most charts online blend all three into one line and one national average, which is why so many solar and battery owners come away thinking wholesale prices and their power bill are the same number.
They aren't. This is a working guide to reading the chart properly: separate New South Wales and Queensland series, units converted accurately, tariff structure shown alongside the spot market, and one uncomfortable finding that matters more than any other to a battery owner: the price spread available to batteries has been shrinking even as battery capacity grows.
NSW and Queensland Wholesale Price Chart
Start with the long view, region by region. The table below is the wholesale series that settles in the National Electricity Market, in the unit the market uses.
Annual volume-weighted average spot prices, Queensland and New South Wales
| Financial year | Queensland $/MWh | New South Wales $/MWh |
|---|---|---|
| 2013–14 | 61 | 61 |
| 2021–22 | 162 | 178 |
| 2022–23 | 145 | 157 |
| 2023–24 | 88 | 101 |
| 2024–25 | 110 | 125 |
The figures come from the AER's annual volume-weighted average spot prices by region, expressed in dollars per megawatt-hour.
Queensland's move from $61/MWh in 2013–14 to $162/MWh in 2021–22 is an increase of about 165%. It did not stay there. The state fell to $145/MWh in 2022–23, dropped to $88/MWh in 2023–24 (roughly 46% below the peak), then rose again to $110/MWh in 2024–25. New South Wales opened the decade at the same $61/MWh, climbed higher to $178/MWh in 2021–22, then printed $157, $101 and $125 across the following three years. In each comparison year, New South Wales sat above Queensland.
Read alone, those two columns destroy the idea of an "Australian electricity price". There is a New South Wales price and a Queensland price, and the gap between them changes direction and size from year to year.
Converting megawatt-hours into bill-sized numbers
Most households can't picture a megawatt-hour. Convert it once and the scale lands. $110/MWh is 11 cents per kilowatt-hour and $125/MWh is 12.5 cents per kilowatt-hour.
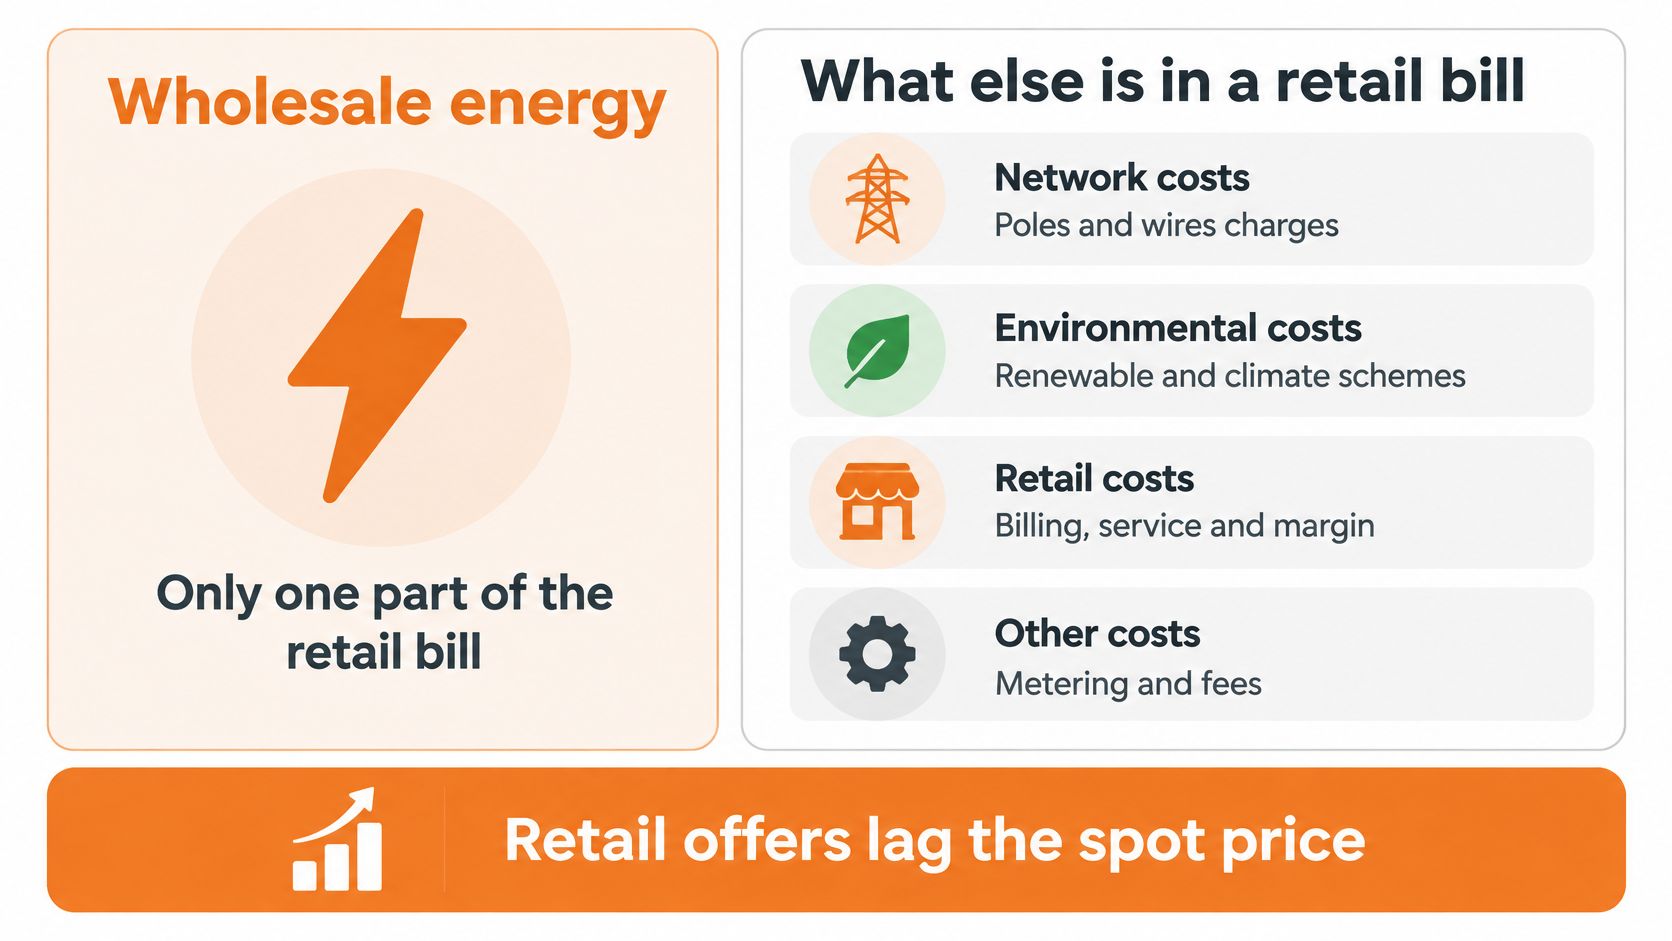
Neither of those is a tariff. A household pays a retail rate that wraps network costs, environmental scheme costs, metering, retail margin and the daily supply charge into a plan price. An 11 c/kWh wholesale average tells you what the energy component of the system traded at across a year. It does not tell you what any customer paid.
What an annual average cannot show
An annual volume-weighted average smooths 365 days into one number. Inside that year sit five-minute dispatch intervals where the price hit several hundred dollars, and intervals where it went below zero. A battery responds to intervals, not to averages, so the yearly table is the wrong instrument for a daily decision. It's the right instrument for judging whether the market has changed over a decade.
Read rule: compare a region with itself over time first, then compare Queensland and New South Wales within the same year. Never treat either column as the rate printed on a power bill.
Labels That Make a Price Chart Usable
The National Electricity Market spot price is the regional dispatch price for energy, set every five minutes for each region. It is not a bill rate and it isn't a forecast of one. AEMO's National Electricity Market data dashboard publishes Queensland and New South Wales dispatch prices at five-minute granularity alongside demand, generation and interconnector flows, and the spot prices shown there are time-weighted.
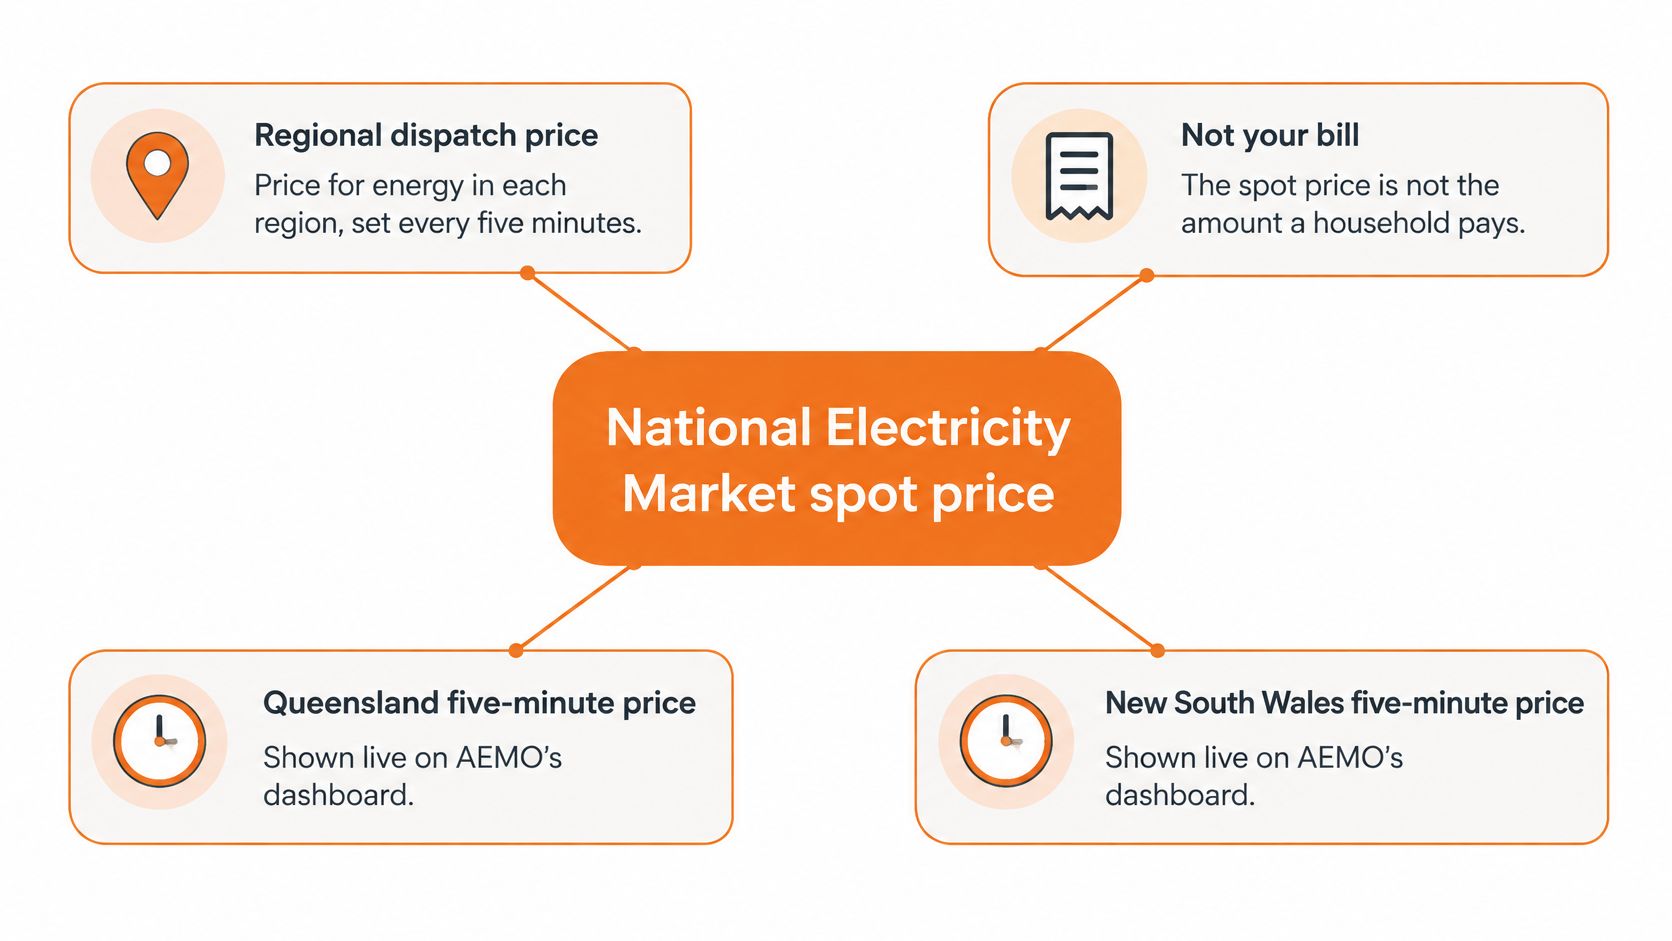
Five-minute granularity isn't a technicality. Since Five-Minute Settlement began on 1 October 2021, the market's energy prices and cap-related calculations have been based on five-minute dispatch periods. An hourly average built on top of those periods can hide a short spike or a negative interval that changes what an import, export or discharge is worth.
The five labels every chart needs
- Region. QLD or NSW, stated plainly. A two-state chart without a label per line is decorative, not analytic.
- Timestamp and interval. The date, the time, and whether the value covers five minutes, 30 minutes or a year.
- Actual or forecast. Actual dispatch prices and pre-dispatch forecasts are different products and shouldn't share a line without a marker.
- Unit. Dollars per megawatt-hour or cents per kilowatt-hour, with the conversion stated once: 1 $/MWh = 0.1 c/kWh.
- Scope. Wholesale energy only, or wholesale plus something else.
A mistaken reading and the correct one
The common error is treating a low wholesale interval as a cheap time to import power. On a flat retail tariff, that low interval is worth nothing to the household, because the import rate doesn't move. The correct reading is that the low interval matters only if the customer's plan passes wholesale exposure through, or if the battery can store energy for a later period when the applicable rate is higher. The same logic runs in reverse for a high interval, which is not automatically a high feed-in credit.
Before anything gets acted on, the retail usage rate, feed-in credit, network charges, losses, metering arrangements and any export limit all have to be applied. A battery schedule should compare the avoided retail import cost against the export opportunity cost, not charge whenever the chart is blue.
Retail Tariff Categories on the Same Chart
A household electricity price chart is a set of categories, not one cents-per-kilowatt-hour average. Queensland Government guidance on electricity prices and tariffs sets out the distinction cleanly. A flat tariff applies one per-unit usage charge regardless of time, plus a daily supply charge. A time-of-use tariff applies different usage prices across peak, shoulder and off-peak periods, also with a daily supply charge.
That structure is the reason two households with identical consumption can receive very different bills. The chart has to show which structure applies before any comparison means anything.
What a household electricity price chart should separate
| Chart field | Flat tariff | Time-of-use tariff |
|---|---|---|
| Usage price | One rate at any time of day | Different peak, shoulder and off-peak rates |
| Daily supply charge | Charged as well as usage | Charged as well as usage |
| Loads worth shifting | Little reward for moving use | Battery charging, EV charging, discretionary appliances |
| Export or feed-in | Separate credit, not the import rate | May differ between daytime and evening |
| GST and zone | State if GST is included and name the distribution zone | State season, zone and whether GST is included |
The Queensland guidance names the loads these cheaper windows exist for: battery storage, electric-vehicle charging and discretionary appliances. Those are the three loads a household can move, and they're the three a useful chart should be built around. If you want the mechanics of how distributors price those windows, peak pricing explained by Axis Meter Solutions covers how time-of-use rates are structured in practice.
Build a second series for exports
Solar households need a separate export line, because surplus generation can be exported for a feed-in credit and time-of-use feed-in tariffs can pay different amounts during the day and the evening. The Australian Government notes that some plans offer cheaper daytime energy, which suits battery charging, while others reward evening export. Those two plan designs pull a battery in opposite directions, and a single import price line can't show the difference.
The benchmark that actually decides dispatch
The measure worth calculating is the net value of a battery action. Discharge when the avoided import cost exceeds the value of the energy you'd be holding. Export when the applicable export credit is worth more than the energy is worth to you later, after leaving a household reserve intact. Anything simpler than that produces confident answers to the wrong question.
A wholesale price, a retail import rate and a feed-in tariff are three separate numbers with three separate uses. Our guide to electricity tariff structure walks through how the layers stack in a Queensland or New South Wales plan.
Why Wholesale Can Fall While the Bill Rises
This is the question that arrives in every inbox after a price announcement. From 1 July 2025, standing-offer prices rose by 8.3% to 9.7% in New South Wales and 0.5% to 3.7% in South-East Queensland, according to the AER's report on wholesale electricity markets and the Default Market Offer. In the same release, the AER reported 2025 wholesale prices of $118.77/MWh in New South Wales and $95.00/MWh in Queensland.
Set those two facts side by side and the answer is plain. Wholesale energy is one component of a regulated benchmark, and the rest of the benchmark moved in the other direction.
The bill stack, item by item
A solar-and-battery household's bill is a stack, and each layer has its own logic and its own timing.
- Daily supply charge. Fixed, and payable whether the house imports a single kilowatt-hour or none.
- Usage rate on imports. The number often called "the price of electricity", set by the retailer.
- Network and distribution charges. Set by the distributor, reviewed on a separate cycle, and not affected by a quiet week in the spot market.
- Concessions and rebates. Applied and withdrawn on government timetables, which is why bill headlines swing so hard.
- Feed-in credits. Credited separately, often at a rate nothing like the import rate.
Retail offers also lag the spot market. A price set in a regulatory determination in May doesn't reset because the spot market softened in August.
The rebate effect, measured properly
The distortion is visible in the CPI series. Excluding Commonwealth and state government electricity rebates, Australian electricity prices rose 5.0% in the year to October 2025, according to the ABS monthly CPI release. The larger headline movements came when support was withdrawn: the ABS attributed an annual rise to Queensland's state electricity rebate being used up, as reported in its November 2025 CPI release.
A chart that plots rebate-inflated bill movements against wholesale spot prices isn't comparing two prices. It's comparing a price to a policy.
What the projections say, and what they don't
The Australian Energy Market Commission projected in its 2024 residential electricity price trends report that Queensland residential prices would fall by approximately 15% over the following 10 years, against a projected national decline of 13%, or about 5 cents per kilowatt-hour, under its base case. New South Wales was projected to follow national trends, with all cost components falling slightly.
Those are base-case projections, not guarantees. A battery payback model that assumes today's peak-to-off-peak retail gap persists for the full life of the asset is overstating its certainty. Our explainer on the cost of electricity covers the longer retail story, including how network and environmental layers are forecast to move.
For a battery owner, the practical consequence is that bill reduction comes from two places, not one. Buying or storing energy at a low value is the first. Avoiding retail-rate imports and reducing exposure to the fixed daily supply charge is the second, and it's the one that survives a soft wholesale market.
Quarterly Swings and Negative Price Intervals
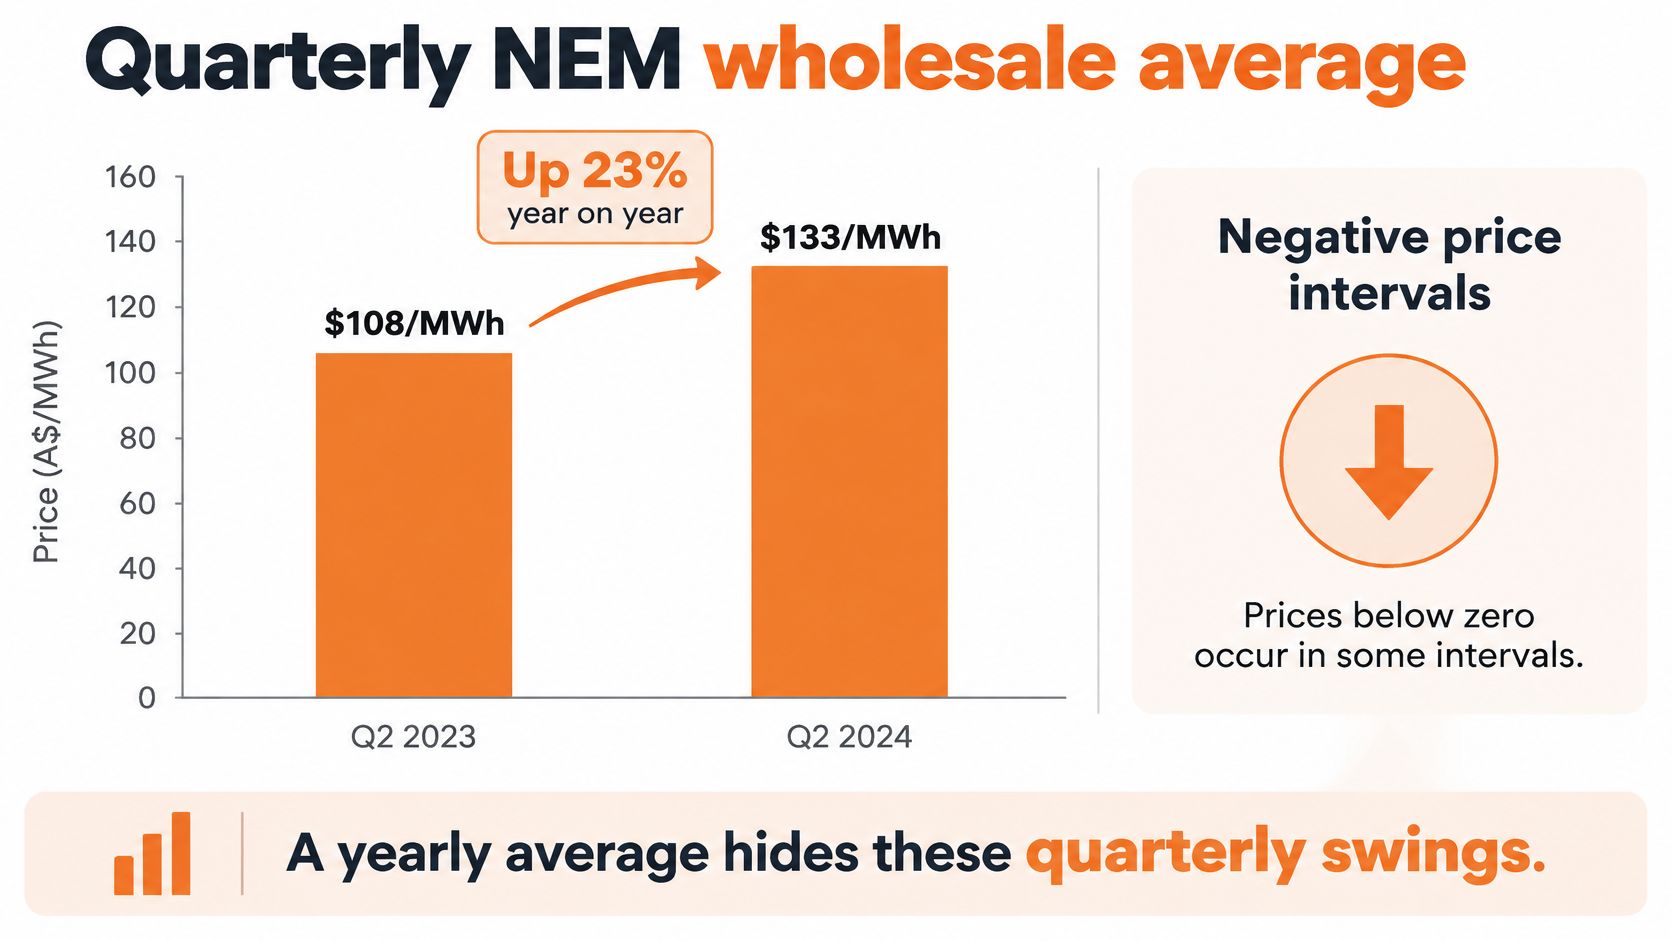
A yearly average is a poor planning tool, and the quarterly record shows exactly why. AEMO's Quarterly Energy Dynamics for Q2 2024 recorded a national wholesale average of $133/MWh for the quarter, 23% above the $108/MWh of the same quarter in 2023, with New South Wales averaging $173/MWh against Queensland's $101/MWh inside the same three months.
That is a gap of $72/MWh, roughly 71% above Queensland's level, between two connected regions of one market. A single national series would have printed something in between and been accurate for neither state.
Selected quarterly wholesale averages in the NEM
| Period | NEM average $/MWh | NSW $/MWh | Queensland $/MWh |
|---|---|---|---|
| Q2 2023 | 108 | Not reported | Not reported |
| Q2 2024 | 133 | 173 | 101 |
The actionable reading is regional, not national. A New South Wales household that priced its exposure off the $133/MWh national column would understate the quarter's wholesale cost by $40/MWh. A Queensland household using the same column would overstate it by $32/MWh. Same market, same quarter, materially different planning numbers depending on which side of the border the meter sits.
The quarterly resolution matters for a second reason. A battery household's planning horizon is seasonal, since solar output, heating load and cooling load all shift by quarter. An annual average smooths the quarters where the money moves.
The negative-price record
Averages also hide the intervals that matter most to a battery. AEMO's Q4 2024 Quarterly Energy Dynamics reported that 23.1% of NEM dispatch intervals had negative wholesale prices in that quarter, the highest quarterly frequency on record at the time. Queensland was negative in 20.9% of intervals, down slightly from 21.9% a year earlier, while New South Wales reached an all-time quarterly high of 13.3%.
Nearly one interval in four cleared below zero, yet a chart of quarterly averages would show nothing unusual. This is why a usable price chart pairs the average line with a measure of negative-interval frequency: the average describes the quarter's level, while the frequency describes how often a storage asset could have bought energy for less than nothing.
Negative prices cluster when supply is abundant relative to demand, typically across the solar midday. For a battery owner, the mechanic is straightforward and conditional: a negative or near-zero interval can be a charging window, and the stored energy can be held for a later peak. The condition is that the retail tariff, the export limit and the household reserve all support the action.
A negative wholesale price does not mean the household gets paid to charge. It means the energy market cleared below zero. What the household experiences depends entirely on the plan and the metering setup.
When the Battery Price Spread Shrinks
Here's the finding that reframes battery economics. AEMO's Q3 2025 Quarterly Energy Dynamics reported that the NEM-wide price spread available to batteries fell 64%, from $339/MWh in Q3 2024 to $123/MWh in Q3 2025. Earnings from simple buy-low, sell-high fell even as battery capacity and output kept growing.
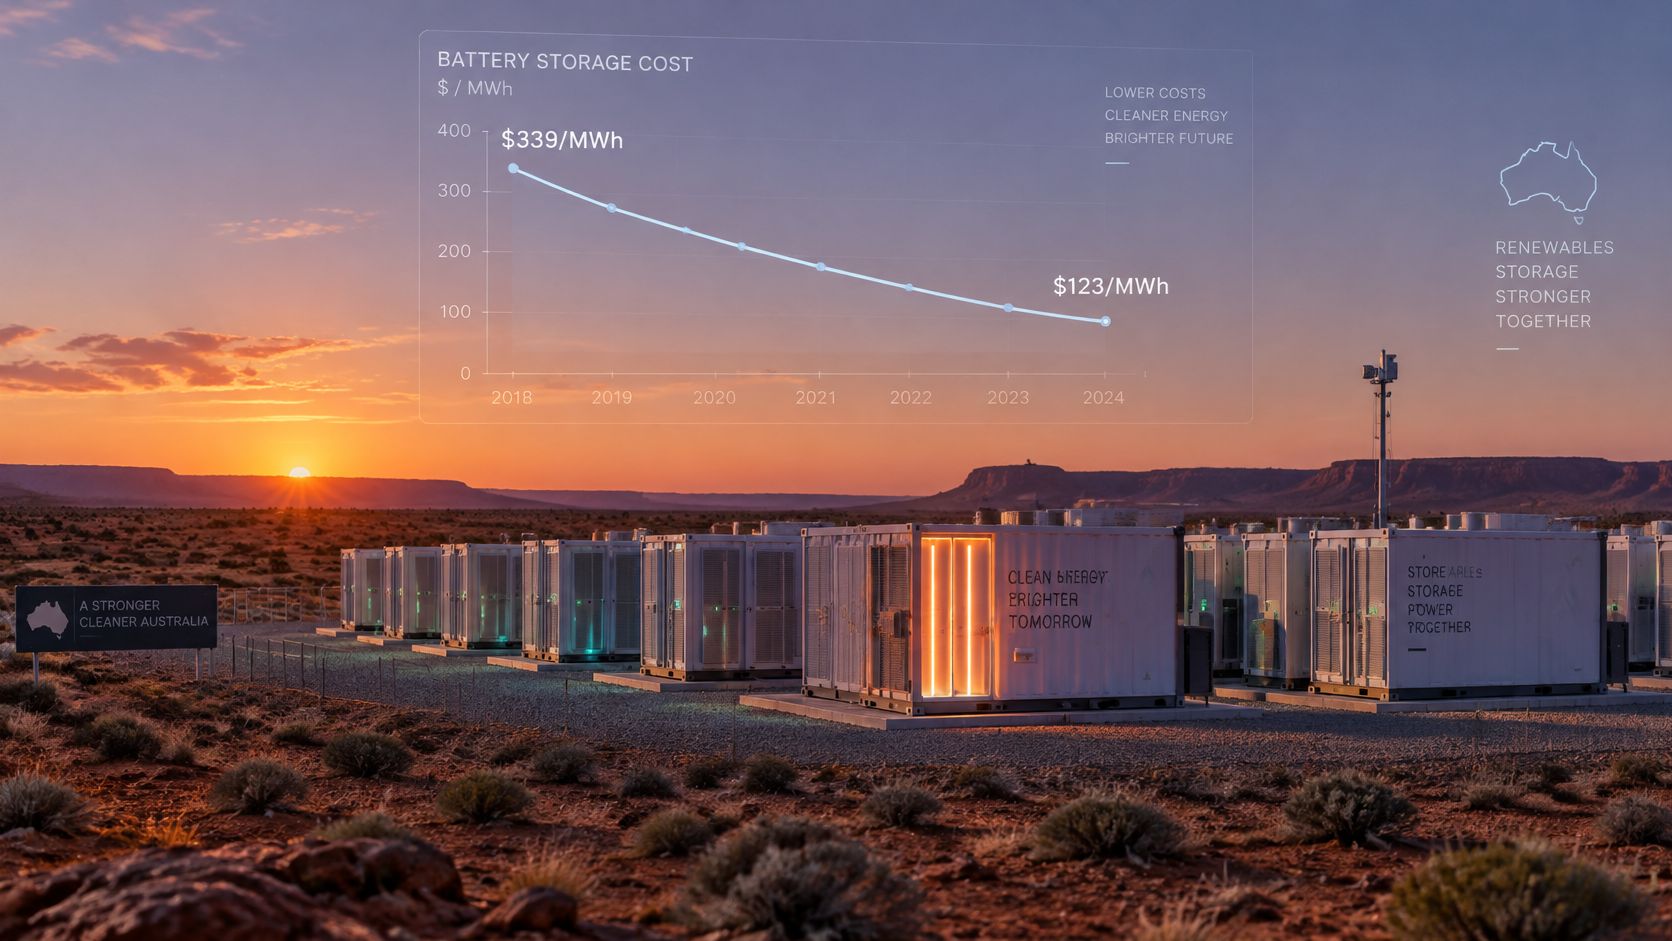
The cause is in the same report. Distributed-PV output rose 11% year on year to a record level for a third quarter, while operational demand averaged 22,323 MW, up 2.3%. More rooftop solar pushes daytime prices lower, including into the negative band counted in the previous quarter's data. That compresses the gap between the cheap hours and the expensive ones, which is precisely the gap a trading battery harvests.
Where the value moves instead
The conclusion isn't that batteries stopped paying. It's that the payment source is shifting from energy arbitrage toward timing, capacity and coordination.
- The evening peak. Household demand is highest after solar falls away, and that's when a stored kilowatt-hour avoids the highest retail import rate of the day.
- Avoided retail imports. A battery that powers the house through the peak earns the full retail rate it would otherwise pay, not the wholesale spread.
- Contingency and balancing services. Grid operators pay for fast, reliable capacity, and aggregated household batteries can provide it.
- Load shaping. Shifting EV charging and hot water into low-value windows lowers the bill without any export at all.
Take a household with a battery that only trades the wholesale gap. In a quarter where that gap narrowed by 64%, its earnings fall sharply. Take the same battery covering the house through the evening peak, and it still avoids the retail import rate on every kilowatt-hour it supplies. Same hardware, different revenue base.
The video below walks through how home battery systems interact with grid signals, which is where the remaining value sits.
Knowing when not to dispatch
There is a real cost to chasing every spike. If the spike lasts five minutes and dispatching into it would leave the household short through the evening, keeping the reserve is usually worth more than the interval. Wholesale price declines don't remove the value of a battery. They relocate it, from trading energy to serving the load behind the meter and to the services the system will pay for.
A useful chart shows hourly prices, the solar-generation window, the evening peak, any negative or near-zero intervals, and a note that household savings sit below gross market value once round-trip losses, export limits and plan rules are applied.
Which Price to Use for Each Decision
Wrong-price decisions are common and expensive. Here is the mapping, one decision at a time, using the earlier sections as the reference.
Charging the battery from the grid. Use the retail import rate for that hour from your own Energy Plan. A low wholesale interval only matters if your plan passes that exposure through to you.
Holding solar in the battery instead of exporting it. Compare the evening import rate you would otherwise pay against the feed-in credit you give up by not exporting now. If the evening rate is higher, storing beats exporting, provided the round-trip losses don't erase the difference.
Exporting to the grid. Use your plan's export credit and the applicable export limit, not the NEM spot price, unless your retailer settles exports on a spot pass-through basis.
Supporting the grid with spare capacity. The household reserve comes first. A short spike is not a reason to empty a battery that might be needed before the next solar day. Grid support works on capacity that isn't otherwise committed.
Reading a bill after a wholesale price fall. Go back to the bill stack. Supply charges, network charges and rebate settings can all rise while the annual spot average falls.
Checking what the market is doing right now. AEMO's dashboard is the reference for regional five-minute prices, read with the labels set out above. If you want to automate the loads that surround the battery, practical smart home tips for beginners covers how smart plugs and schedules handle the discretionary appliances.
Comparing plans. Use the tariff fields: time of day, import rate, export credit, daily supply charge, zone, season and GST treatment.
The HighFlow app shows live prices and home energy, and uses price, weather, PV and usage forecasts to create and execute an optimal battery plan with manual override at any time. Our guide to electricity price forecasting explains how those inputs combine.
Priority rule: your household's energy use is always met before any capacity is offered to the grid. A forecast is an input to a decision, not an instruction.
Key Takeaways
- Wholesale spot prices are regional dispatch prices in dollars per megawatt-hour, not household bill rates.
- Queensland averaged $162/MWh in 2021–22 and $110/MWh in 2024–25, while New South Wales averaged $178/MWh and $125/MWh over the same two years.
- One $/MWh equals 0.1 cents per kilowatt-hour, so $140/MWh is 14 c/kWh before retail, network and other charges are applied.
- Five-minute prices reveal spikes and negative intervals that hourly and annual averages conceal.
- A falling wholesale price doesn't guarantee a lower bill, because supply charges, network costs and rebate settings move on their own timetables.
- Battery value depends on the retail import rate avoided, the export credit, the reserve you keep and the available price spread, and that spread narrowed 64% between Q3 2024 and Q3 2025.
Frequently Asked Questions
Why is New South Wales often higher than Queensland in the same year?
The two regions have different generation mixes and different exposure to interconnector constraints, so their dispatch prices separate regularly. In the second quarter of 2024 New South Wales ran well above Queensland, yet by the first quarter of 2025 the two had converged to within a couple of dollars per megawatt-hour. Compare each year's values rather than assuming a permanent ranking.
Is $/MWh the same as the cents on my power bill?
No. One $/MWh equals 0.1 cents per kilowatt-hour, and even after conversion the wholesale figure is only one component of a retail bill. Network charges, environmental scheme costs, metering, retail margin and the daily supply charge all sit outside it.
Why did wholesale prices fall while my bill rose?
Because wholesale energy is one layer of a regulated benchmark. Supply charges, network costs and rebate settings sit outside the spot market and each moves on its own cycle. Retail offers are also set ahead of time, so they lag spot movements in both directions.
What is a negative price interval?
It's a five-minute dispatch period where the wholesale price for that region falls below zero, which typically happens when renewable output is high relative to demand, often around the solar midday.
Does a negative price mean I'm paid to charge my battery?
Not automatically. The outcome depends on your retail plan, your export limit and the reserve you keep for the household. Many plans charge a normal retail rate regardless of what the wholesale market is doing in that interval.
Does High Flow Energy guarantee a $0 bill?
No. Any allowance depends on eligibility, system size, plan terms and usage, and a bill is still issued each month even when the amount payable is $0.
Check Whether Your Battery Is Underused
Installer defaults can leave a battery technically active and economically idle. It may charge, hold and discharge every day while the bill still carries a daily supply charge and evening imports. The relevant measure is overlap: stored capacity must remain available during high-value evening imports.
Use a recent bill and your battery or app history from the same billing period. Mark each evening import, then check the battery's charge level and discharge behaviour. Three findings indicate underuse:
- Stored energy remains available during evening imports. A reserve or schedule is preventing the battery from covering household demand.
- The battery empties before the evening peak. Check whether discharge timing is using stored energy too early to offset the imports that appear on the bill.
- Exports earn a feed-in credit below the retail rate charged for later imports. The gap between the export credit and avoided import rate is the value each stored kilowatt-hour could have delivered.
Where one of these patterns appears, align charge and discharge settings with the household's peak and tariff structure before reducing any reserve needed for backup.
HighFlow Energy is an electricity retailer for existing solar and battery owners, with the Bill-Free Electricity offer currently available only in New South Wales and Queensland service areas. It uses your existing home battery to support the electricity grid when it has spare capacity, and the value earned funds your monthly bill-free electricity allowance. Your household energy use is always prioritised before grid support.
Current allowance tiers range from 300 kWh up to 1,000 kWh per billing month, depending on solar and battery system size. Within the allowance, the offer covers the daily supply charge, usage charges and network and distribution charges. Electricity above the allowance is charged at the applicable excess usage rate, with no penalties for exceeding it. There is no fixed contract term and no exit fee; the allowance continues while you remain eligible and stay with HighFlow Energy.
The Basic Plan Information Document sets out key pricing details, eligibility requirements and important conditions for each residential market offer. The Residential Electricity Agreement, Price Schedule and VPP Market Services Agreement contain the full binding terms. Standard non-energy fees can include disconnection or reconnection fees, special meter reads, and dishonour or late payment fees, as listed in the Price Schedule.
If keeping a reserve matters, set that threshold before trading stored energy for a short price spike; guidance on keeping your family powered during outages can help with that decision.
To check whether your system and usage pattern fit an allowance tier, visit HighFlow Energy and request an eligibility assessment.