

Energy Cost Calculator Australia: Inputs, Tariffs & Outputs
You've checked the solar production, watched the battery charge during the day, and still opened the latest electricity bill with an uncomfortable question: why is the amount higher than expected? For a Sydney or Brisbane household with rooftop solar and a battery, the answer usually isn't found by multiplying appliance watts by hours of use. A useful energy cost calculator Australia model must account for tariffs, fixed charges, solar exports, battery dispatch and, where relevant, Virtual Power Plant participation.
What an Energy Cost Calculator Actually Does in Australia
Most simple calculators answer a narrow question: what does one appliance cost to run? They ask for watts, hours and a cents-per-kilowatt-hour rate. That approach can be useful for a heater or hot-water system, but it doesn't model the bill faced by a solar and battery owner.
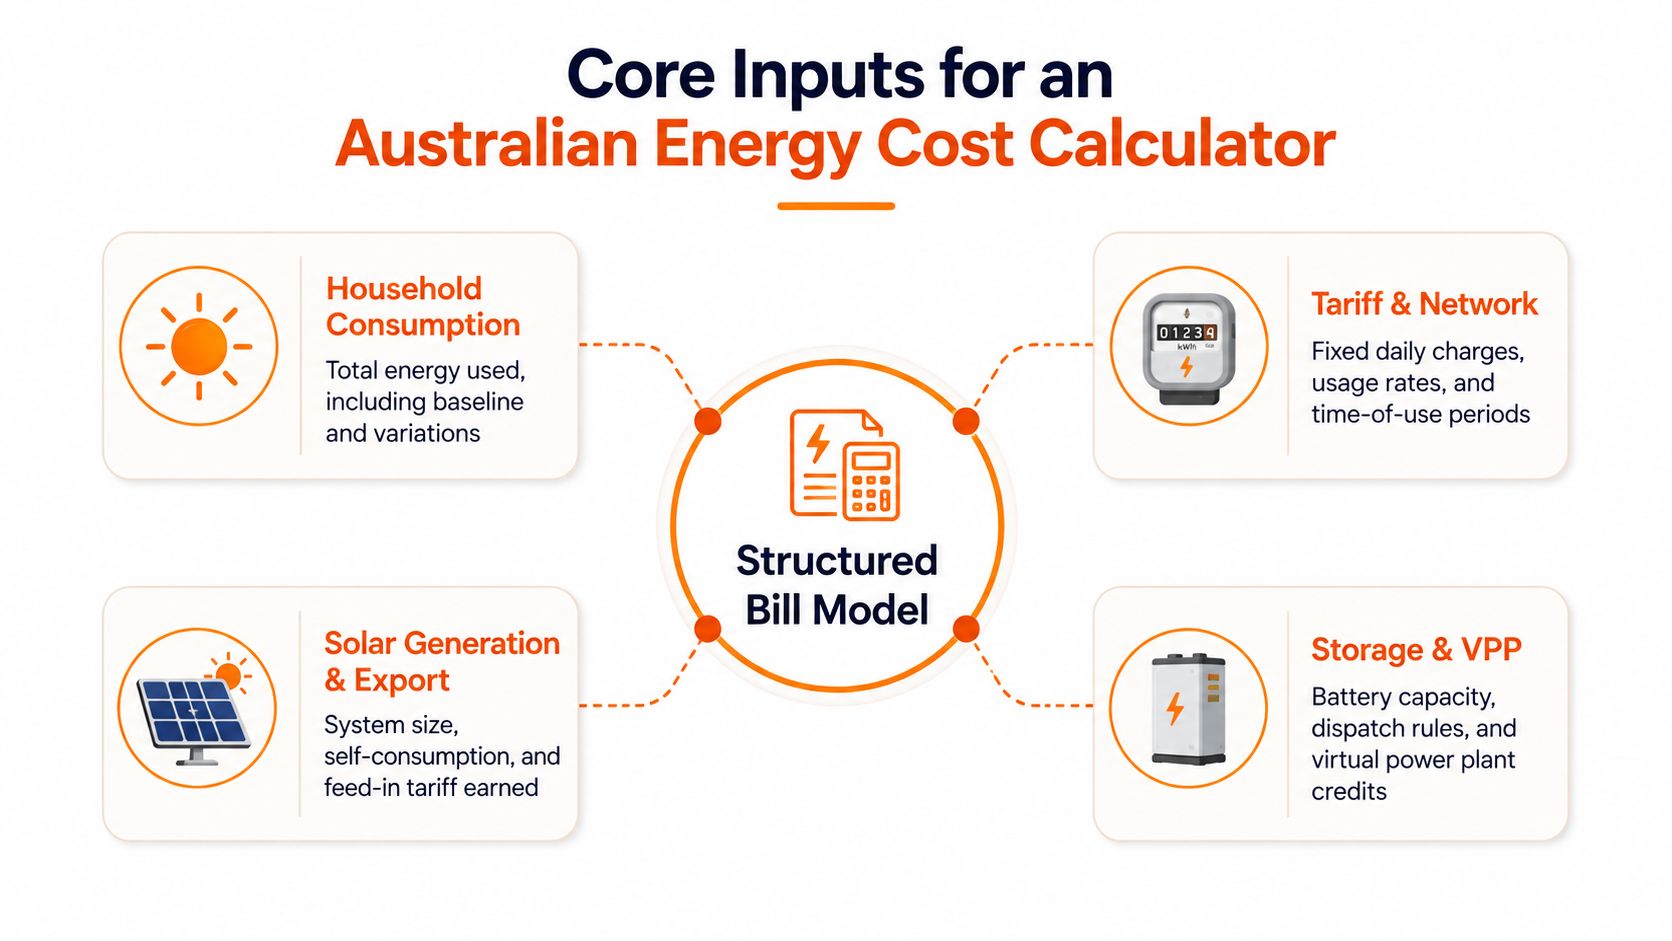
A household bill model starts with four input families:
- Usage, including how much electricity the home consumes and when.
- Tariff structure, such as flat-rate, time-of-use or demand pricing.
- Fixed charges, including the daily supply charge.
- Distributed energy resources, including solar, batteries, exports and VPP credits.
The Australian Energy Regulator describes the supply charge as a fixed payment for supplying a property, independent of how much energy the property uses. That distinction matters because a battery can reduce imports without removing the underlying connection cost. You can read the regulator's explanation of fixed and variable electricity bill charges when checking your own bill.
The model should then separate energy imported from the grid, energy generated by solar, energy stored or discharged by the battery, and energy exported. A flat calculator may treat every kilowatt-hour as having the same value. A better model recognises that an imported kilowatt-hour during a peak window may be treated differently from a solar kilowatt-hour used immediately in the home.
This article builds that model in a practical order. You'll see which inputs matter, how Queensland and New South Wales tariffs differ, how a sample calculation is structured, and how a VPP input can change the result. For households reviewing hot-water demand, a separate guide to instant hot water system bills can help identify one of the larger flexible loads in the home.
The Core Inputs Every Australian Bill Model Needs
A credible energy cost calculator Australia tool is a structured bill model, not just a wattage shortcut. It should show the assumptions it uses, allow you to replace defaults with information from your bill, and distinguish between energy costs and credits.
Usage data comes first
Start with total consumption, normally measured in kilowatt-hours. A daily average is a useful entry point, but an hourly or half-hourly profile is more informative because it shows whether the home uses electricity during solar-generation hours or later in the evening.
Seasonal variation also matters. Heating, cooling, hot water, cooking and electric vehicles can shift both the total amount used and the time of use. A model that uses one annual average may hide the periods when the battery is most valuable.
Tariffs determine the value of timing
A flat tariff applies one usage rate. A time-of-use tariff applies different rates across defined periods. A demand tariff adds another layer by charging according to a measured peak rather than only total consumption.
The calculator should record the tariff name, usage rates, time windows and any demand rule. It should also identify the distributor, because the network component can vary within a state.
Fixed charges don't disappear
Daily supply charges apply whether the home imports electricity or not. A 2026 Australian bill comparison placed typical supply charges at about $0.90 to $1.30 per day, with examples of $1.00 per day in Queensland and $1.05 per day in New South Wales. The comparison is available through the Australian Government energy rating calculator.
That source also gives an example of annual household bills of roughly $1,420 in Queensland, $1,450 in New South Wales and $1,580 in South Australia, illustrating why a national average can mislead. A one-dollar daily charge alone adds about $365 a year, before usage is included.
Solar and battery inputs complete the picture
A useful model needs solar generation, the portion consumed directly in the home, exported energy and the applicable feed-in tariff. It also needs battery capacity, charging and discharging rules, round-trip efficiency and the way the battery is reserved for household use.
Generic tools often omit export value, battery degradation, seasonal load shifts and demand exposure. Those omissions can make a solar-battery home look more expensive than it is in one calculation, or make a battery strategy look more profitable than it will be in practice.
For a practical explanation of consumption calculations, compare your bill inputs with High Flow Energy's energy consumption calculation guide. The key test is simple: if a calculator asks only for usage and one tariff, it isn't modelling the full economics of a battery-backed home.
Tariff Nuances That Change the Result in Queensland and NSW
The same household profile can produce a different result in Queensland and New South Wales because the tariff structure changes the value of timing. A calculator must identify the distributor and tariff before it estimates savings from solar or storage.
Queensland adds a demand question
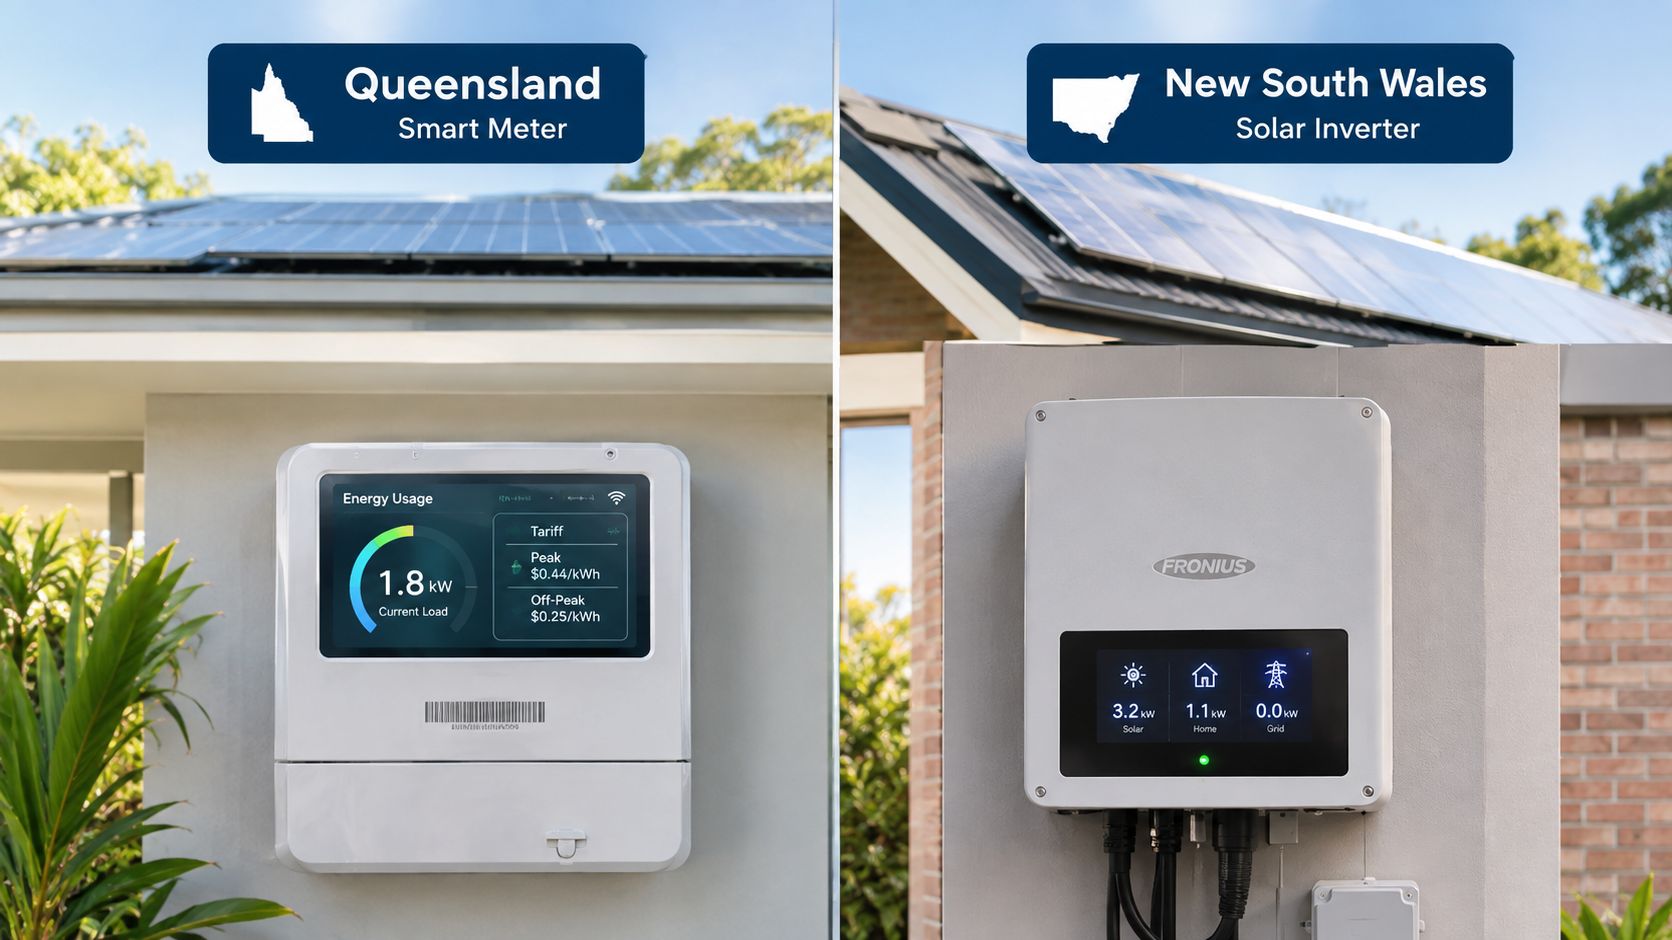
Energex's residential smart-meter TOU and demand tariff includes a fixed supply charge of $0.444 per day and a demand charge of $7.00 per kilowatt. The demand component is based on the highest half-hourly demand recorded between 4 pm and 9 pm, on weekdays and weekends, as set out in Energex's residential tariff information.
That changes battery modelling. The battery isn't only shifting kilowatt-hours from the afternoon to the evening. It may also reduce the household's measured peak during the demand window. A calculator that records total imports but ignores the highest half-hourly demand can miss a major controllable cost.
The model should therefore simulate large loads operating together. Air conditioning, cooking, hot water, pool equipment and electric vehicle charging can create a peak even when annual usage looks moderate. Battery discharge timing becomes as important as total battery capacity.
A household considering other electricity-dependent purchases can also benefit from comparing whole-of-home operating costs. For example, a guide on whether e-bikes are worth it may help separate transport energy use from household electricity demand, but the charging profile still needs to be included if the e-bike charges at home.
NSW requires distributor-level detail
New South Wales households may be on a standard flat-rate tariff or a time-of-use option. The relevant supply charge and usage benchmark can vary significantly between distributor zones.
The Australian Energy Regulator's 2026–27 Default Market Offer sets the reference prices from 1 July 2026. In New South Wales, the annual reference prices range from $1,899 in Ausgrid to $2,604 in Essential Energy. In South East Queensland, the representative Energex bill is $1,988, down $155 year-on-year, while flat-rate standing offer prices fall by 7.2% in that region. The AER also reports reductions of up to 10.7% for South East Queensland time-of-use standing offers. These figures are detailed in the AER's final 2026–27 Default Market Offer release.
The practical lesson is that postcode matters. A NSW household shouldn't compare itself with one national average, and a Queensland household shouldn't assume a flat usage rate captures a demand tariff.
For a plain-English explanation of how these components fit together, use High Flow Energy's electricity tariff structure guide.
The video is most useful when viewed alongside an actual bill. Look for the tariff name, supply charge, usage periods and any demand line before entering values into a calculator.
Sample Calculation for a QLD Household and a NSW Household
A worked example shows why the structure matters, but the figures below are an illustrative calculation, not a forecast or a retailer quote. The verified data supports the fixed-charge anchors and the AER reference prices, but it doesn't provide a complete set of usage rates, household consumption or solar-generation inputs for a reproducible retailer bill.
The safe way to use a sample is to separate known reference values from assumptions. For example, the model can use the Queensland supply-charge anchor of $1.00 per day and the NSW anchor of $1.05 per day, then ask the household to replace usage, export and tariff values with the numbers on its bill.
The calculation sequence
For either state, calculate the annual result in this order:
- Add the daily supply charge across the billing year.
- Calculate grid-imported energy in each applicable tariff period.
- Apply solar self-consumption as a reduction in imports.
- Apply battery discharge according to its dispatch rules.
- Subtract export credits.
- Add any separately modelled demand charge.
- Apply any VPP allowance or credit as a separate line.
For Queensland, the demand line cannot be inferred from annual kWh. The calculator needs the highest half-hourly demand during the Energex window. For New South Wales on a flat tariff, the usage calculation is simpler, but the distributor zone still affects the reference benchmark.
| State and tariff | Daily supply charge | Usage rate band | Annual bill estimate | DMO 2026–27 reference |
|---|---|---|---|---|
| South East Queensland, Energex TOU and demand | About $1.00 per day as a household comparison anchor, Energex network tariff includes $0.444 per day | Replace with the retailer's current TOU rates | Must be calculated from actual imports, periods and demand | $1,988 representative annual bill |
| New South Wales, flat-rate example | About $1.05 per day as a household comparison anchor | Replace with the retailer's current flat rate | Must be calculated from actual imports and exports | $1,899 to $2,604 across NSW distributor zones |
The table deliberately doesn't invent an annual bill from missing inputs. A calculator that displays a precise result without showing its assumed usage, rates, exports and demand exposure creates false confidence.
What the comparison demonstrates
The Queensland household may gain value from reducing evening demand, even if its annual imported energy changes only modestly. The NSW household may gain more from using the battery during a time-of-use peak or from comparing the retailer's total bill against the distributor-specific DMO reference.
For a line-by-line way to organise bill components, see High Flow Energy's utilities bill example. The important output isn't only the final amount. It's the breakdown showing which costs are fixed, which depend on imported energy, which depend on timing, and which come from exports or other credits.
How a Battery and VPP Input Change the Answer
A battery changes the source and timing of energy. It doesn't automatically remove every bill component. In self-consumption mode, the battery can store excess solar and discharge later, reducing grid imports, but the daily supply charge generally remains.
The next input is dispatch logic. A calculator should ask whether the battery prioritises household consumption, preserves a reserve, responds to time-of-use periods, suppresses Queensland demand peaks or participates in a VPP. These rules can produce different outcomes from the same battery capacity.
The order of value matters
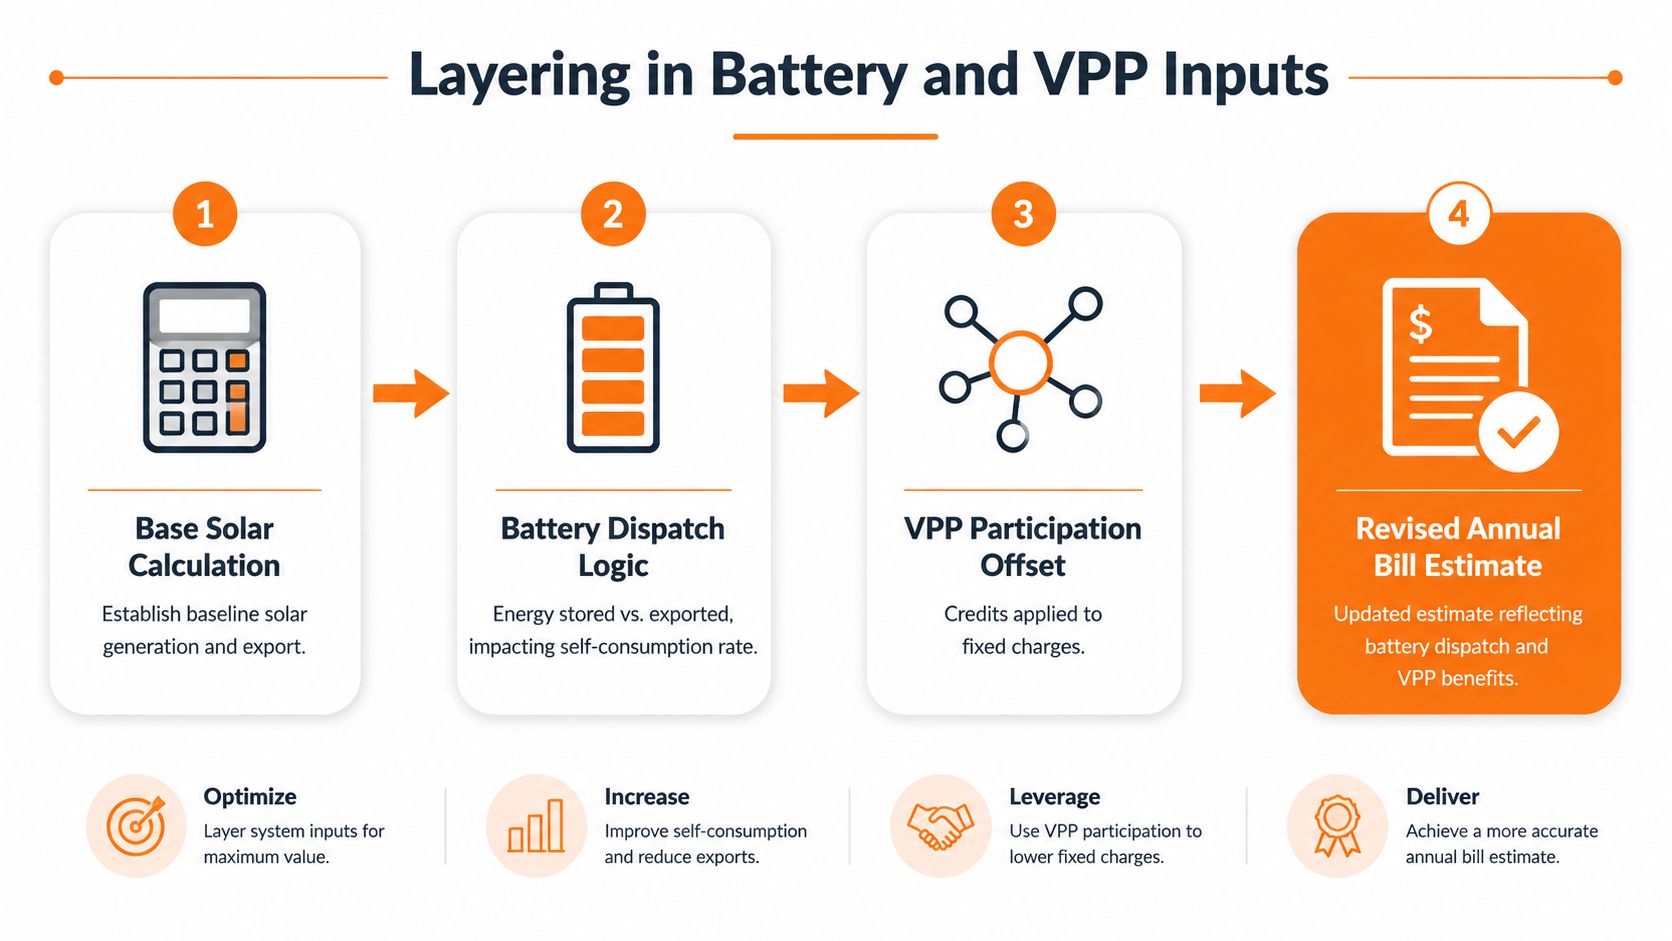
A useful model layers the battery and VPP inputs rather than combining them into one unexplained credit:
- Base solar calculation: Estimate household imports and exports without storage.
- Battery dispatch: Move stored energy into the periods where it reduces imports or demand exposure.
- Export treatment: Apply the feed-in tariff to energy that still leaves the property.
- VPP participation: Add the applicable allowance or credit, subject to the programme's rules and household priorities.
- Revised bill: Show the remaining supply, usage, demand and export lines separately.
A retailer-based VPP may create value through coordinated grid support, demand response and wholesale-market participation. The household should still retain priority access to stored energy, understand the dispatch conditions, and see how any allowance is applied.
High Flow Energy offers a BYOB VPP model for eligible existing solar and compatible battery owners. Its stated structure uses a bill-free electricity allowance that can cover daily supply charges and usage up to the allowance, with household priority, no new hardware, no lock-in contracts and no exit fees. Usage beyond the allowance is billed at standard rates, and retail services are provided under authorised energy retail frameworks.
That allowance should be entered into a calculator as a separate scenario, not treated as a guaranteed saving. The result depends on eligibility, the battery's compatibility, actual consumption, programme terms and the amount of energy used beyond the allowance.
Practical rule: Model the household first, then model the battery, then add any VPP credit as a clearly labelled scenario.
Common Misconceptions That Skew the Result
A calculator can be mathematically correct and still answer the wrong question if its assumptions are incomplete.
The lowest headline usage rate always wins
A low cents-per-kilowatt-hour figure may not produce the lowest total bill. Supply charges, tariff windows, demand exposure and export treatment can outweigh a headline rate difference. Compare plans using actual bill data, not the usage rate in isolation.
Solar feed-in is the main payback
Export credits matter, but solar value also comes from using generation in the home and avoiding grid imports. A battery adds another layer by moving energy into later periods. The calculator should show direct solar use, battery discharge and exports as separate flows.
Battery economics are mostly about self-consumption
Self-consumption is only one lever. Discharge timing can affect TOU usage, peak demand and participation in grid services. In Queensland, the Energex demand rule makes the evening peak especially important, as covered earlier.
A national average is good enough
It isn't. The 2026–27 AER reference prices range from $1,899 to $2,604 across NSW distributor zones, so location within one state changes the benchmark substantially. A credible model uses postcode, distributor and tariff details.
The AER's explanation of supply charges confirms that the fixed line isn't based on usage. Network charges also enter the bill through the regulated distribution framework. The AER's 2025–26 network charge decision explains that approved distributor charges are incorporated into retail electricity prices.
Energy Consumers Australia notes that network charges can make up up to 50% of an electricity bill, which is why a model should identify network-related components rather than treating the retailer's usage price as the whole cost. See its explanation of what makes up an electricity bill.
Using Calculators Effectively and the Limits of the Result
Start with a calculator that exposes its inputs. If it hides the tariff assumptions or defaults to one cents-per-kilowatt-hour value, treat the output as a rough indication rather than a household bill estimate.
Use the latest bill to replace default values. Enter the distributor, tariff name, supply charge, usage periods, export credit and any demand information. If the tool accepts interval data, use it. If it doesn't, record that limitation beside the result.
Run separate scenarios for:
- Solar without a battery.
- Solar with current battery dispatch.
- Battery dispatch with peak-demand suppression.
- A time-of-use tariff, where available.
- VPP participation, with the allowance or credit shown separately.
A calculator also has limits. It can't predict every wholesale price movement, network constraint, export restriction or future grid-services payment. Wholesale price volatility and demand events can change the value of flexible storage, while battery cycling and warranty conditions can affect whether a strategy remains suitable over time.
Compare the result against the relevant AER DMO reference, not just a national average. Then check whether your battery is being used at the times that matter financially, rather than only reaching a high state of charge.
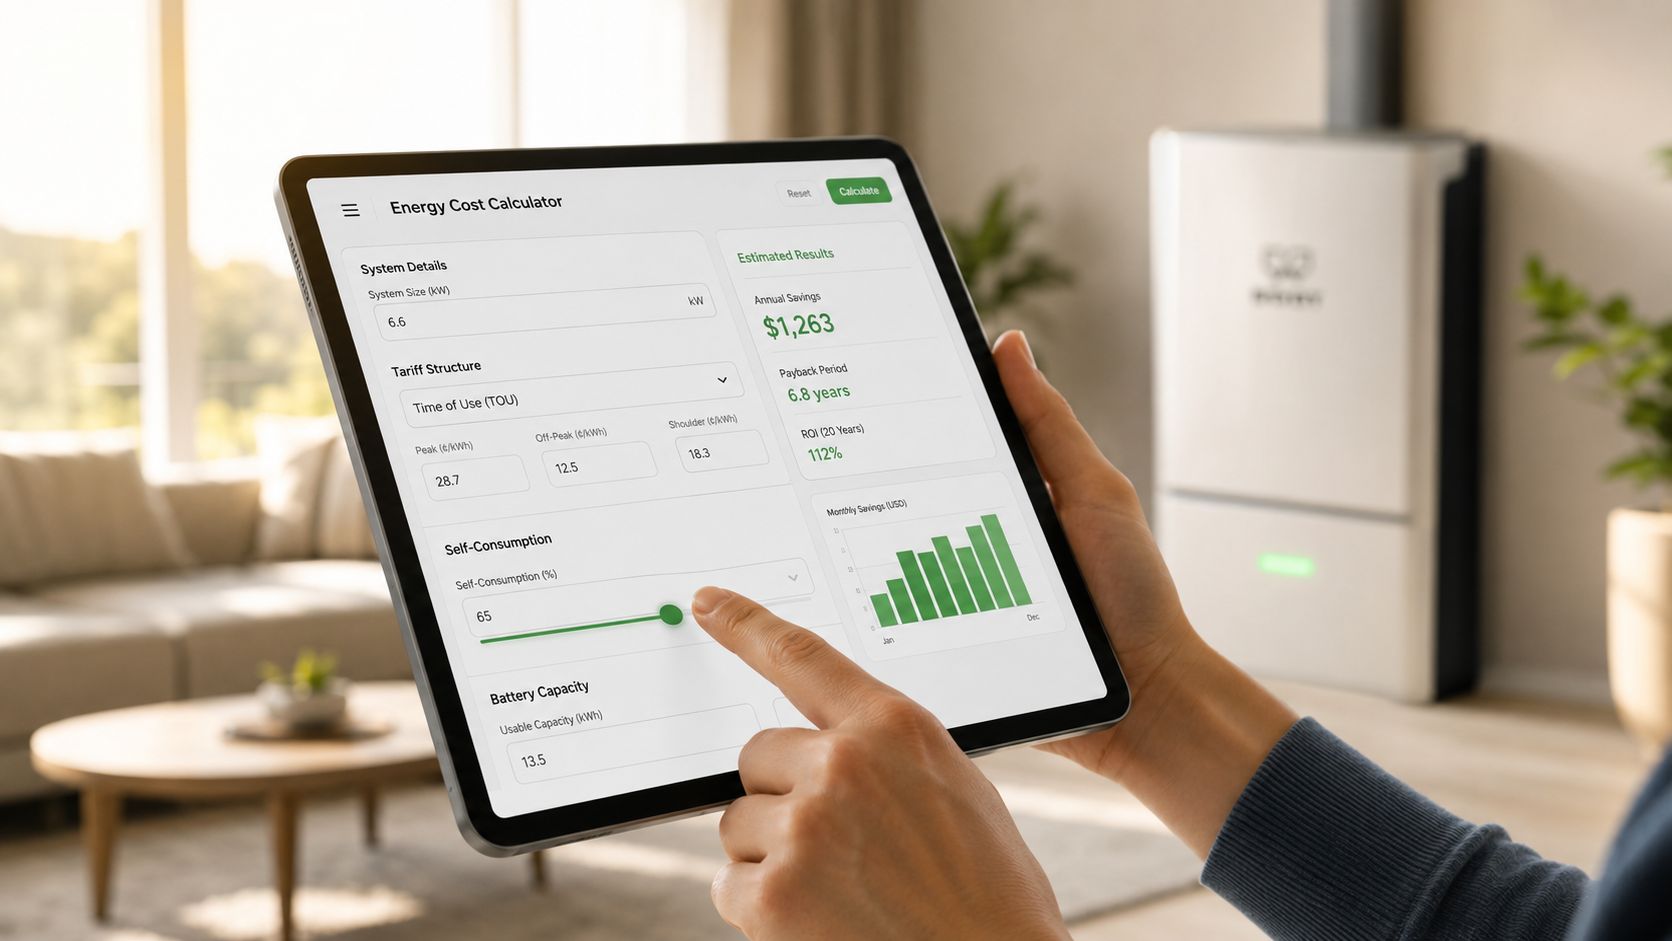
Most battery owners focus on installation quality. Far fewer focus on ongoing performance and optimisation. A properly structured BYOB VPP can be assessed as one part of that performance review, alongside tariff choice, battery dispatch, export value and household demand.
High Flow Energy is an Australian electricity retailer and VPP operator for eligible existing solar and battery owners in Queensland and New South Wales. If you want to assess whether your battery is underutilised, review your current electricity performance and understand how a coordinated VPP allowance may fit your bill model, visit HighFlow Energy to request an eligibility assessment.
Frequently asked questions
What does an energy cost calculator Australia tool measure?
It estimates a household's electricity bill from usage, tariff structure, fixed charges, solar generation, battery behaviour, exports and applicable credits. A basic appliance calculator measures only the cost of running one device.
Why does the daily supply charge matter for solar households?
The supply charge applies for connection to the property and isn't based on energy usage. Solar and batteries can reduce imports, but they don't automatically remove this fixed component.
Does a Queensland calculator need demand data?
It does if the household is on a tariff with a demand component. Energex's relevant tariff applies a demand charge based on the highest half-hourly demand during the stated evening window, so annual kWh alone isn't enough.
Should NSW households use the same benchmark?
No. The AER's 2026–27 reference prices vary between NSW distributor zones. A postcode and distributor-specific comparison is more useful than one state-wide or national average.
Can a battery eliminate an electricity bill?
A battery can reduce grid imports and may improve the value of solar, but fixed charges and other bill components can remain. Any claim of bill elimination needs to be qualified by the tariff, usage, battery behaviour and programme terms.
What is a BYOB VPP?
BYOB means Bring Your Own Battery. A compatible existing battery is coordinated through a Virtual Power Plant so it can support household needs and, subject to the programme rules, provide grid-support services.
What should I check before joining a VPP?
Review household priority rules, dispatch controls, allowance conditions, retailer authorisation, warranty considerations, contract terms, exit arrangements and how the programme reports battery activity. The calculator should show the VPP value as a separate scenario.
Key takeaways
- A reliable Australian calculator models the whole bill, not only appliance usage.
- Daily supply charges must be separated from variable usage charges.
- Queensland demand tariffs require peak-demand modelling, not just annual kWh.
- NSW calculations should use the relevant distributor zone and tariff.
- Solar self-consumption, export credits and battery dispatch are different inputs.
- A VPP allowance should be shown separately and tested against actual household usage.
- The most useful output is a transparent breakdown of avoidable and unavoidable costs.