

Savings Projection Calculator Explained for Battery Owners
Households with both solar and a battery paid approximately 40% less for electricity than households without solar, the ACCC found in its 2023–24 review of the National Electricity Market. That's the benchmark every battery owner wants applied to their own bill, and the one most often misapplied.
The misapplication is arithmetic. Someone takes an average, applies it to your annual spend, and presents the output as a forecast. A number arrives, but it can't tell you which part of your battery is earning it, which part is a tariff artefact, and which part was a one-off payment that won't repeat next year.
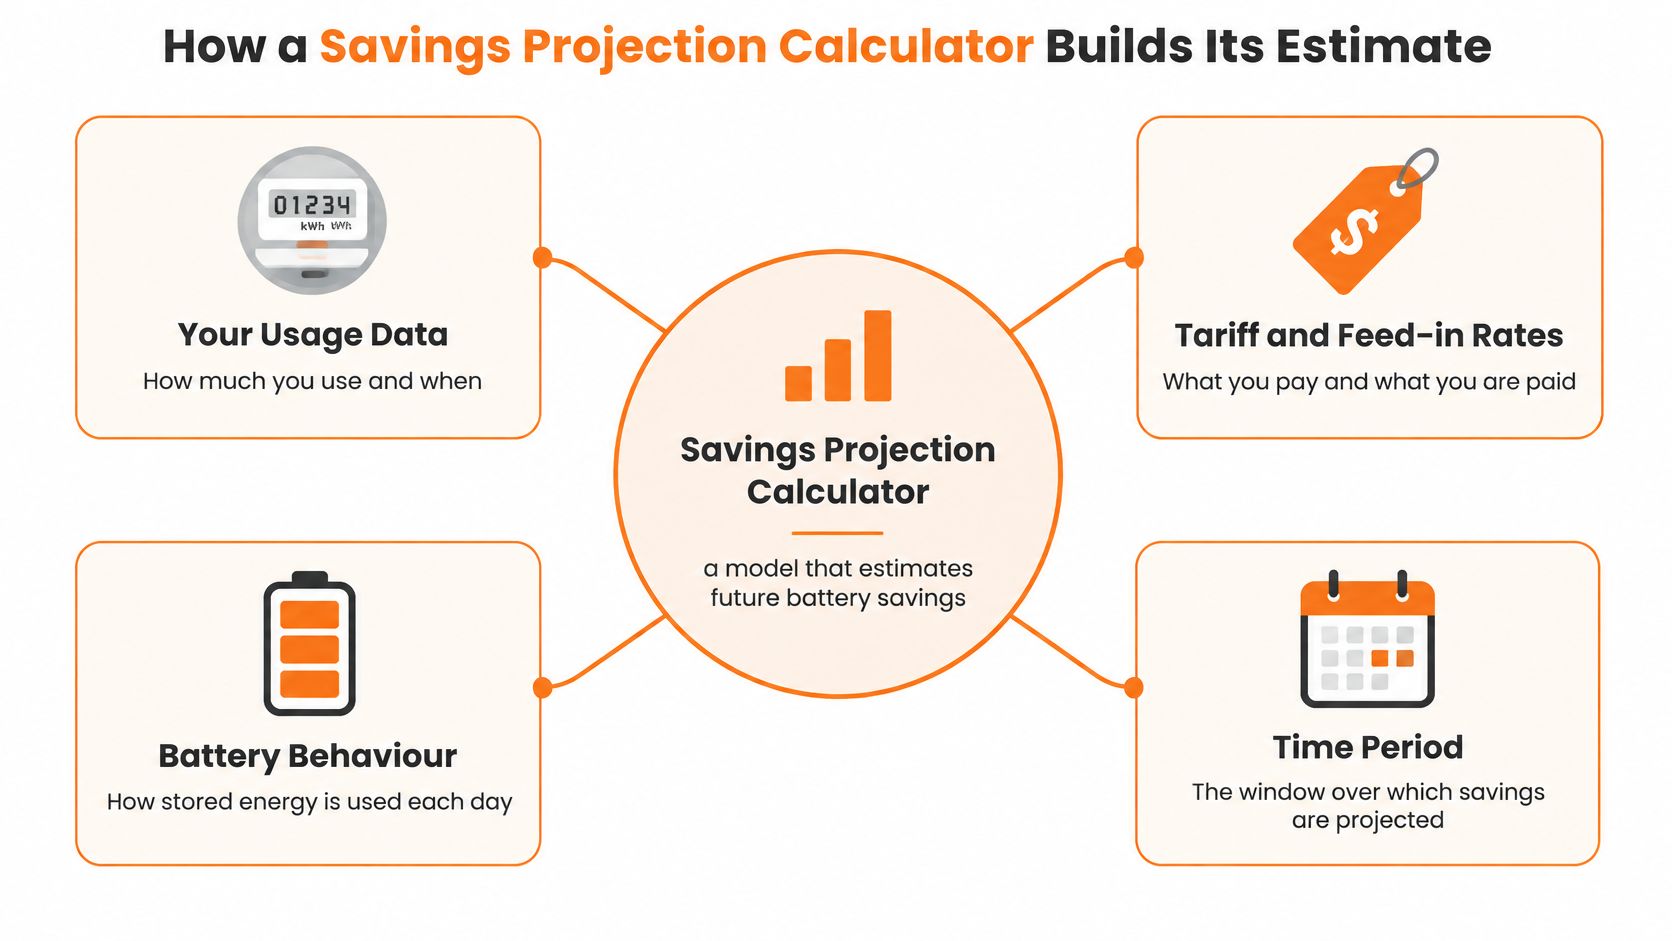
A savings projection calculator does something different. It rebuilds the estimate from your tariff, your usage, your solar output and your battery's daily behaviour, then reports each source of value on its own line. That separation is what makes the figure checkable rather than merely plausible.
How a Savings Projection Calculator Builds Its Estimate
A useful projection separates five value streams before adding them together: avoided imports, export opportunity, supply charges, grid-service credits and one-off rebates. Each depends on different inputs and assumptions, so a single headline savings figure can hide what is recurring, what is conditional and what is a one-time reduction in cost.
A calculator builds the estimate by matching electricity use and generation to the tariff periods in which they occur. Annual totals alone obscure that timing. A time-series model can distinguish energy bought from the grid at one rate from solar exported at another.
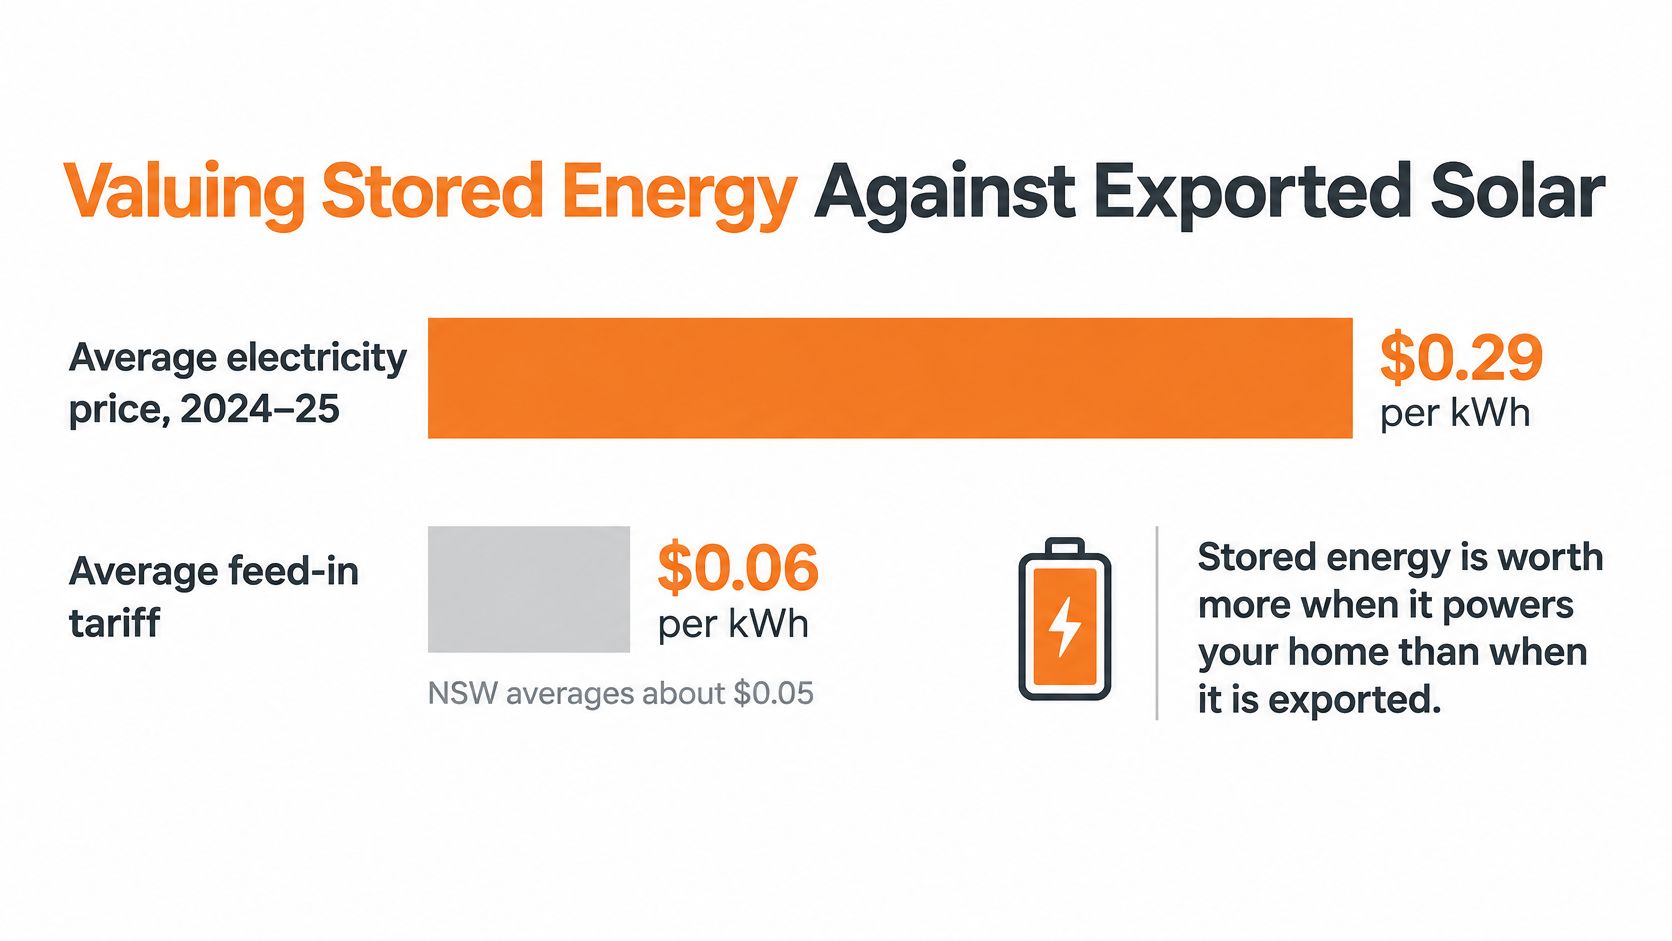
The Australian Bureau of Statistics' analysis of household solar generation reported an average electricity price of $0.29 per kWh in 2024–25 and an average feed-in tariff of $0.06 per kWh. Those averages illustrate why an exported kilowatt-hour and an avoided import should not be valued equally. A household's actual rates depend on its plan and location.
Regional prices also affect a projection. The Australian Energy Market Commission's 2025 outlook work drew on the Australian Energy Regulator's 2025–26 Default Market Offer determination. Without a directly applicable regional figure, a calculator should use the customer's tariff rather than substitute a national average.
| Component | What it measures | How it is valued |
|---|---|---|
| Avoided grid imports | Energy the home no longer buys from the grid | Kilowatt-hours avoided multiplied by the tariff rate in each time period |
| Export opportunity | Solar or battery energy sent to the grid | Kilowatt-hours exported multiplied by the feed-in tariff |
| Daily supply charge reduction | Fixed daily charges covered by a bill-free allowance | Days multiplied by the daily charge covered |
| VPP or grid-service credit | Value earned by providing spare battery capacity to support the grid | Credit amounts reported separately from bill savings |
| One-off rebate | Temporary government or retailer payments | Recorded separately and excluded from recurring savings |
The categories matter because they answer different questions. Avoided imports and export value depend on energy flows and prices; grid-service credits depend on participation and the value generated. A supply-charge reduction applies only where the relevant charge is covered, while a rebate reduces an upfront cost rather than a recurring bill.
The Cheaper Home Batteries program offered eligible households around a 30% discount on the upfront cost of a battery from 1 July 2025. That amount belongs in a separate one-off line, not in annual bill savings.
What to ask any calculator: Can it show avoided imports, export value, supply-charge reduction, grid-service credit and any rebate as separate figures? If it reports only one total, you cannot see which assumptions drive the result.
The estimate is only as useful as the inputs behind those separate lines. Collect the relevant bill, tariff and system details before comparing projections.
Inputs That Change Your Projected Savings
Seven inputs do most of the work, and each pushes the result in a different direction. Miss one and the projection usually drifts upwards.
| Input | Where to find it | Effect on the projection |
|---|---|---|
| Tariff structure | Electricity bill or retailer plan document | Single-rate, time-of-use, controlled load or demand tariffs change when stored energy is worth most |
| Annual consumption | Twelve months of bills or smart meter data | Higher evening load increases how much stored energy the home can use |
| Usable battery capacity | Battery specification sheet | Sets the energy available per cycle; use usable, not nominal, capacity |
| Round-trip efficiency | Manufacturer data or measured performance | A 5 kWh charge at 90% delivers 4.5 kWh to the home, so losses shrink every discharge line |
| Feed-in tariff | Current retailer offer | Sets the value of exported energy, which varies by retailer and state |
| Export limit | Distributor connection approval | Caps how much solar can be exported, changing the export line |
| Solar generation profile | Installer design or monitoring app | Seasonal swings change how often the battery charges from solar |
Start with the tariff, not the hardware
The Australian Government identifies four residential electricity tariff types, single rate, time-of-use, controlled load and demand tariffs, and under a time-of-use tariff the rate changes according to the time of day, so projected savings depend on when the battery charges and discharges rather than on annual consumption alone (energy.gov.au tariff guidance).
That single fact reshapes the whole model. A battery that fills at 10am and empties at 6pm earns the peak rate on every kilowatt-hour. The same battery on a flat tariff earns the same amount whenever it discharges. Same hardware, different answer.
Use usable capacity and honest efficiency
Nameplate capacity is a marketing number. Usable capacity is what the inverter will let you cycle, and it's the figure that belongs in the model. Efficiency works the same way. Charge 5 kWh into a battery with 90% round-trip efficiency and 4.5 kWh comes back out, so every discharge calculation starts from the smaller number.
The remaining inputs set the ceiling. Your distributor's export limit caps how much surplus solar leaves the property, which caps the export line. The solar generation profile decides how often the battery has anything to store, and that swings hard between a January week and a July week.
Before you run a projection, work through this list:
- Pull twelve months of bills or download smart meter data.
- Write down the peak, off-peak and shoulder windows on your tariff.
- Confirm usable capacity from the specification sheet, not the brochure headline.
- Confirm the export limit with your distributor.
- Record the feed-in rate in your current offer, not last year's.
An estimated input tends to inflate the answer, because the gaps get filled with generous defaults. Where the tariff itself might move, our notes on electricity price forecasting explain how forward contract prices feed into retail offers.
Valuing Stored Energy Against Exported Solar
Two uses of the same kilowatt-hour are not worth the same, and the difference is the entire economic case for a battery. When stored energy discharges into the home, it displaces a retail purchase. When the same energy is exported, it earns the feed-in rate and nothing more.
| Use of solar energy | Energy delivered per day | Value across a year |
|---|---|---|
| Stored and used at home | 4.5 kWh | About $476 |
| Exported to the grid | 5.0 kWh | About $110 |
The arithmetic behind those rows is simple enough to check on a calculator. Take 5 kWh of surplus solar. Store it, accept 90% round-trip efficiency, and 4.5 kWh reaches the appliances, worth $1.31 a day at the national average price of $0.29 per kWh, which is roughly $476 over 365 days. Export the same 5 kWh at $0.06 and you earn $0.30 a day, about $110 a year.
State the assumptions plainly: one full cycle every day, national averages rather than your bill, and no daily supply charges in either case. Change any of those and the numbers move, but the ratio doesn't collapse.
The reason the gap is structural rather than a quirk of this year's pricing is how feed-in payments are built. The Australian Government notes that feed-in tariffs differ between retailers and states, and that the price households pay bundles wholesale, transmission, distribution, metering, environmental, retailing and GST costs, while the payment for exported power is generally based only on the wholesale component (guide to reducing energy bills). Modelling an exported kilowatt-hour at the retail rate is a reliable way to inflate a projection.
Exported solar is a wholesale sale. Self-consumed solar is a retail purchase avoided. A calculator that treats them as equal has quietly deleted the battery from its own model.
Metering arrangements decide how that asymmetry shows up on your bill, and our explanation of net metering and solar covers how imports and exports are recorded. For a Queensland view of how feed-in rates appear on an actual account, this solar billing advice for Brisbane homeowners walks through the line items.
Then run the comparison yourself. Replace both averages with your own peak rate and your own feed-in rate, and see how many daily cycles it takes to justify the battery's cost.
Protecting Household Reserve Before Grid Services

A virtual power plant is a coordinated aggregation of rooftop solar, batteries and controllable loads. Inside that aggregation, batteries respond to frequency deviations, pre-charge ahead of high-price events and discharge when market prices rise. The household sees none of it, which is precisely the point and precisely the risk.
The modelling risk is that the same stored kilowatt-hour cannot serve the home and the grid at once. A projection that counts the full battery against both obligations will overstate the return, because it's spending the same energy twice.
The reserve arithmetic
A credible model simulates state of charge against battery power limits, charge and discharge efficiency, reserve percentage, export constraints and event availability. Take a battery with 10 kWh usable and a 30% reserve. That's 3 kWh held for the household and 7 kWh theoretically available to grid events, minus whatever the round-trip losses remove.
A projection that credits all 10 kWh to grid service while also assuming the home is fully backed up has invented energy. The reserve percentage is the correction, and it should appear in the model as a hard constraint rather than a footnote.
The minimum state-of-charge setting does more than protect backup. It limits participation on cold, dark evenings when the household is drawing hard and the battery can't afford to sell. Forecast error cuts the same way. If the model assumed a mild week and the household ran the air conditioning, the spare capacity it counted on wasn't there.
Practical rule: set your reserve percentage against what your household genuinely needs to ride out an outage, then accept grid-service valuations only on the capacity left over. The order matters, not the arithmetic alone.
Smaller reserves release more capacity to the market and leave less cushion for a storm. Bigger reserves protect the household and shrink the grid-service line. Neither is wrong, but the projection has to show which one it assumed.
Battery Only Versus Battery Plus VPP
A battery's value can appear in several places on a bill or projection: electricity bought from the grid, solar exported, supply charges, grid-service credits and any one-off rebates. A single savings figure can obscure which value stream produced it, or whether the same energy has been counted twice.
A useful comparison holds the household load and tariff constant. The battery-only case applies the battery to household use and exports surplus energy. The battery-plus-VPP case adds value from spare capacity used for grid support, while keeping household energy needs first.
| Value stream | Battery only | Battery plus VPP | What to verify |
|---|---|---|---|
| Avoided grid imports | Battery discharge offsets household electricity purchases | The same household use is offset, subject to the battery plan | Both cases use the same load and tariff |
| Export revenue | Feed-in tariff on exported surplus | Feed-in tariff on surplus not committed to grid events | Exported energy is counted once |
| Grid-service credits | None | Value from available spare capacity supporting the grid | Credits appear separately from bill savings |
| Supply charges | Remain payable unless covered by an allowance or credit | Remain payable unless covered by an allowance or credit | Any allowance or credit is shown separately |
| One-off rebates | Included only if the household is eligible | Included only if the household is eligible | Rebates are not treated as recurring savings |
For HighFlow Energy customers, the VPP's value funds a monthly bill-free electricity allowance. That allowance covers daily supply charges, usage within the allowance, and network and distribution charges on that allowance. Any usage above the monthly allowance is charged at the applicable excess usage rate. The monthly bill still arrives, even when the amount payable is $0.
Compare the projections line by line. Check whether supply charges and rebates are included, whether VPP credits are separate, and whether exported energy appears once rather than as both export revenue and grid-service value. The difference between the two cases should come from the VPP value stream, not from changed assumptions.
The useful question is how much additional value the VPP produces after household use and the other bill components are accounted for. A headline total cannot answer that on its own.
Reading Your Projection Results Without Overstating Them
A projected saving is only useful if you can see what produces it. Read the estimate as separate value streams: avoided grid imports, export income, supply charges, grid-service credits and one-off rebates. A single total can hide whether savings depend on lower household imports, battery dispatch, or a payment that will not recur.
Residential electricity price outlooks differ between New South Wales and Queensland. Treat future prices as an assumption in the calculator, not a fixed outcome, and compare results under conservative, expected and higher-price scenarios.
Read the output in this order.
Cumulative cash flow shows the running total of projected savings against system cost. Check which years contribute most. A strong first year can make the total look favourable even if later savings are lower.
Payback is the point at which cumulative savings equal the system cost. It depends on the tariff and other assumptions used. If the projection assumes current feed-in rates continue unchanged, its payback estimate may be too short.
Degradation affects later-year results. Battery capacity falls as cells age, so a projection that holds annual savings flat should show whether it accounts for that decline.
Check these warning signs:
- A single headline figure without a range.
- No degradation assumption in the output.
- VPP credits combined with bill savings, making their separate contribution unclear.
- One-off rebates treated as recurring, which overstates savings in later years.
Write down the conservative and expected annual figures, along with the payback estimate for each scenario. If the calculator does not provide those figures, its precise-looking headline is not enough to assess the projection.
Check Your Battery's Eligibility Against the Projection
HighFlow Energy connects existing rooftop solar and compatible home batteries to a Virtual Power Plant (VPP). The VPP uses spare battery capacity to support the grid, with household energy needs taking priority. The value generated funds a monthly bill-free electricity allowance.
You still receive a bill each month, even if the amount payable is $0. It shows your allowance, usage, bill-free amounts and any excess charges. Your allowance resets monthly. It may change if your system configuration changes or you no longer meet eligibility requirements, and any changes will be communicated clearly. Eligible concessions and rebates are credited automatically.
A projection is an estimate, not a guaranteed saving. Its result depends on your tariff, household usage, usable battery capacity and how often spare capacity is available.
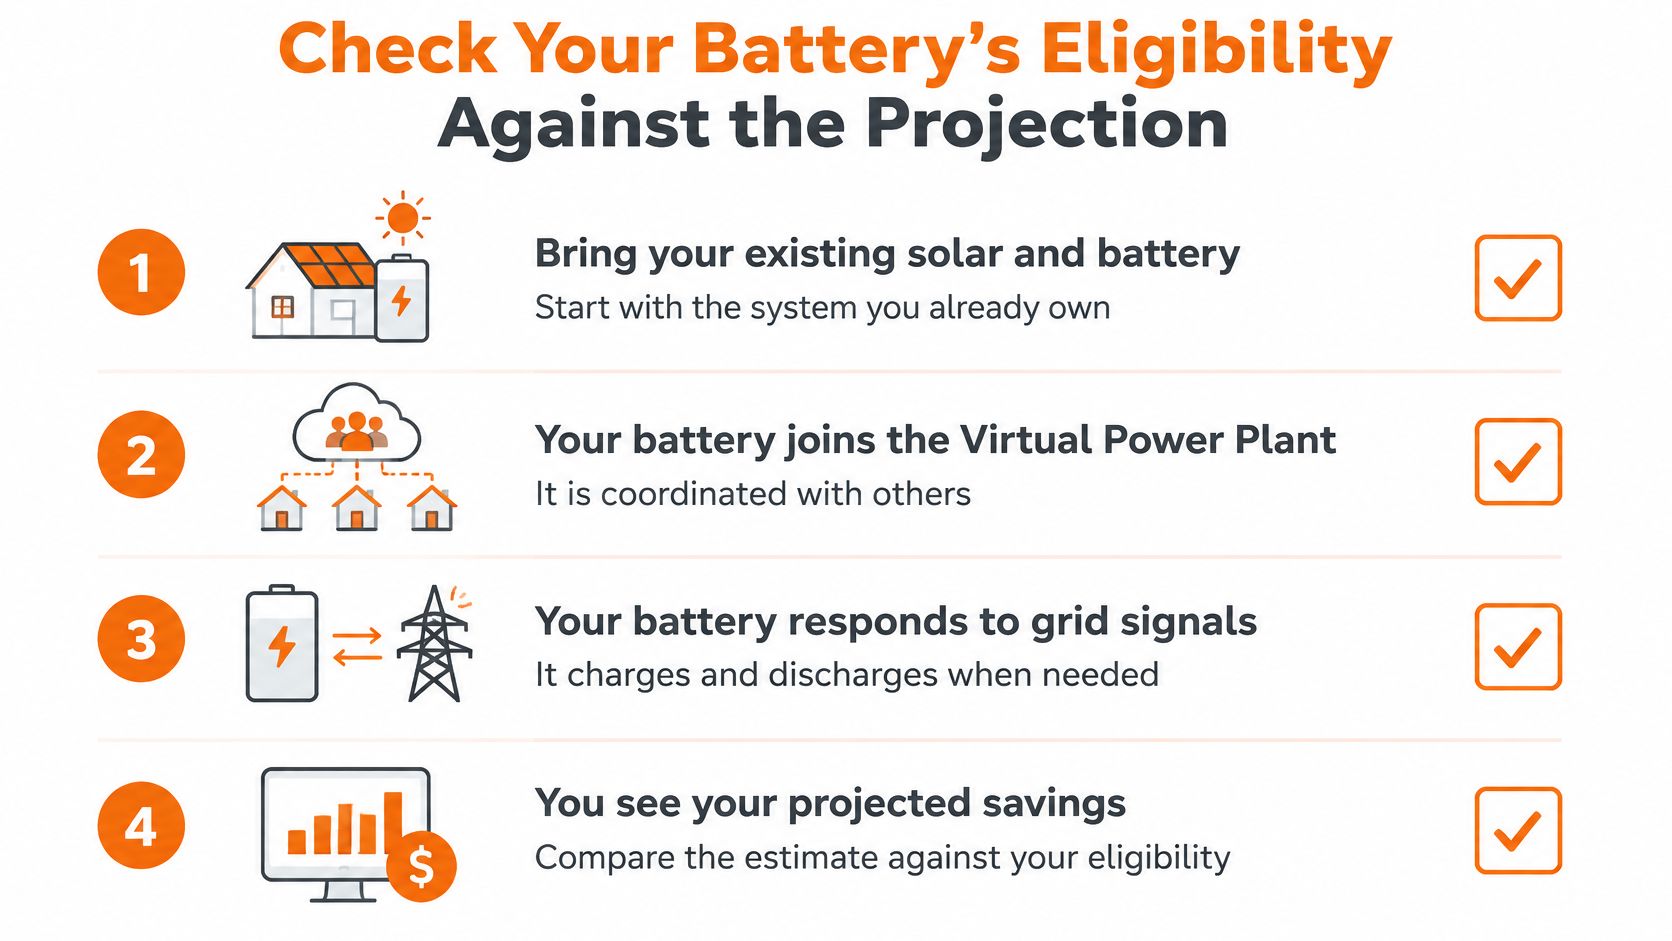
For an estimate to reflect your system, confirm that the battery and inverter meet the system integration requirements. Compare the projection with a year of your electricity bills, then check whether your system meets the eligibility requirements.
HighFlow Energy is available across Queensland and New South Wales. Eligibility requirements apply, and you can visit HighFlow Energy to check whether your system qualifies.