

Solar Panel Life Cycle Cost: What Australian Owners Pay
The usual advice is to divide the installation price by annual electricity savings and call the result your payback period. That's useful, but incomplete. Solar panel life cycle cost also includes the money you'll spend keeping the system productive and eventually removing it from your roof.
For Queensland and New South Wales homeowners, the overlooked variable is often logistics. Getting old panels to a recycler can change the financial result, particularly outside metropolitan areas. A credible assessment therefore needs a cost range, not a single payback date.
What Solar Panel Life Cycle Cost Includes
Life cycle cost is the total money a solar system costs from purchase to removal, usually assessed against the electricity it produces. An installation quote is the start of that calculation, much like a car's sticker price excludes servicing and eventual disposal.
The breakdown separates the upfront purchase from operating and end-of-life expenses.
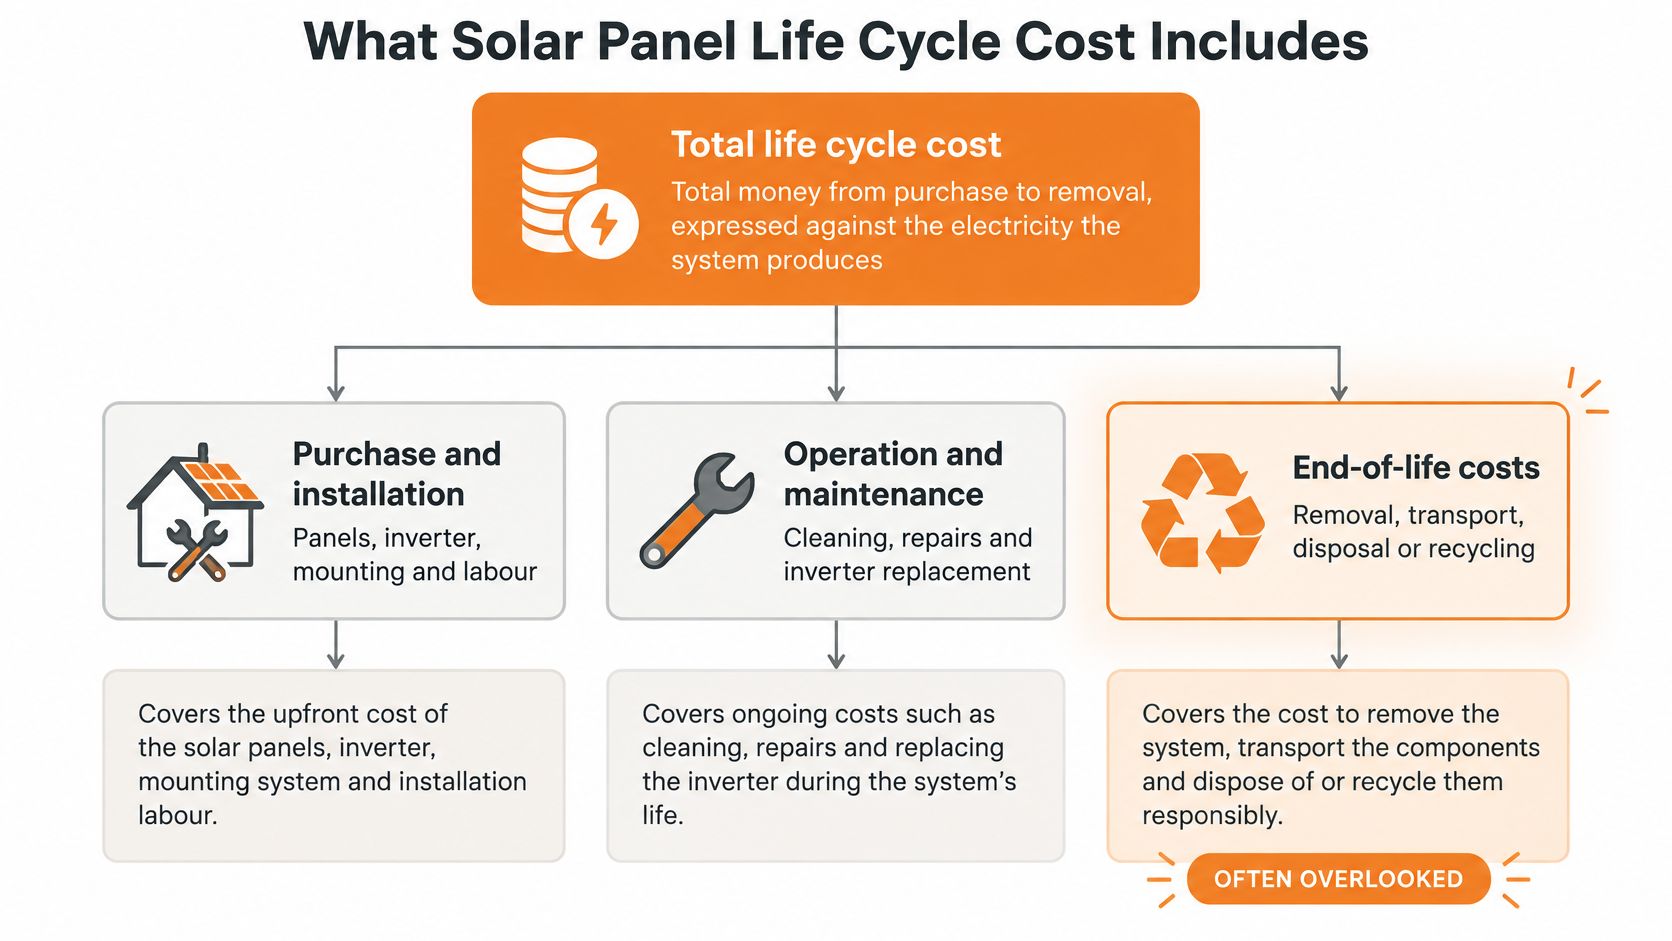
Cost components across a solar system's life
| Stage | What it covers | Australian reference | When it falls |
|---|---|---|---|
| Manufacturing | Module production, embedded in purchase price | Not billed separately | Before installation |
| Installation | Labour, mounting, switchboard and grid connection | Household installation benchmark discussed below | Year 0 |
| Inverter replacement | Replacement power electronics | Obtain a system-specific allowance | Once or more during system life |
| Maintenance | Cleaning, inspection and monitoring | Obtain service-specific estimates | Recurring |
| Degradation | Lost output as modules age | Large-scale modelling assumptions discussed below | Continuous |
| End-of-life | Removal, transport, recycling or landfill | Metropolitan and remote estimates differ | End of system life |
The Australian Bureau of Statistics reported an average household solar-panel installation cost of $1,537.21 per kW in 2024–25, a national benchmark rather than a guaranteed Queensland or NSW quote (ABS household solar electricity generation). Don't assume that benchmark establishes what any particular installer includes.
Manufacturing is already reflected in the panel purchase price. Adding it again would double-count expenditure. Inverter replacement and maintenance need separate allowances because their timing and scope differ from the original installation.
Degradation isn't a bill you receive. It reduces the electricity produced by the money you've already spent. End-of-life handling is different: it creates an eventual cash expense that an installation-only comparison can miss.
Request a complete cost schedule
Use our solar installation cost guide alongside a written schedule covering:
- Initial capital: Equipment, installation and any financing costs.
- Power electronics: Expected inverter replacement scope and labour.
- Maintenance: Inspection, monitoring, cleaning and repairs.
- Output assumptions: Expected generation and the degradation model.
- End-of-life: Roof removal, transport and the chosen disposal pathway.
Keep timing visible. A recurring maintenance allowance and a terminal recycling expense shouldn't disappear inside a single equipment figure.
How Degradation Cuts Lifetime Output
Under constant annual degradation assumptions, a panel retains approximately 88% of initial output after 25 years at 0.5% annual loss, compared with approximately 69% at 1.5% annual loss. These are modelled outcomes, not a promise about an individual rooftop system.
The Australian Energy Council's submission to AEMO recommended those low and high cases for large-scale solar PV, with 1.0% as an average case (AEC degradation assumptions submitted to AEMO).
Remaining output at annual degradation rates
The following values are rounded calculations using those constant annual assumptions. “Year” means elapsed years from the initial output baseline.
| Year | Output at 0.5% a year | Output at 1.0% a year | Output at 1.5% a year |
|---|---|---|---|
| Year 10 | 95% | 90% | 86% |
| Year 15 | 93% | 86% | 80% |
| Year 20 | 90% | 82% | 74% |
| Year 25 | 88% | 78% | 69% |
Degradation means panels gradually produce less electricity. The purchase price doesn't decline alongside that output, so higher degradation increases the effective cost of generation.
There's an important distinction between remaining annual output and cumulative lifetime generation. The difference between the final-year percentages isn't the same as the difference in all electricity generated over the operating period. A sound model sums each year's declining production rather than multiplying the final year's output by the system's age.
A panel producing less than its original rating isn't automatically ready for disposal. Replacement is an economic and safety decision, not just an age threshold.
Apply the assumptions to your own roof
The AEC scenarios concern utility-scale modelling. Don't treat them as measured degradation rates for every household installation. For a rooftop assessment, require an explanation of how module specifications, climate, installation condition and observed performance inform the selected assumption.
Also separate gradual ageing from a fault or temporary production problem. A decline in recorded generation needs diagnosis before it becomes a replacement decision.
Ask which degradation rate the financial model uses, how it compounds, and whether the forecast has been checked against actual generation. An unexplained lifetime-output estimate is too weak a foundation for a precise payback claim.
Levelised Cost Per Kilowatt-Hour Explained
Levelised cost of electricity, or LCOE, expresses lifetime generation costs against lifetime electricity production. A formal calculation accounts for the timing of costs and output, rather than treating future expenditure as identical to money spent today.
Think of it as calculating a car's whole-life cost per kilometre, including servicing and replacement parts. The useful comparison isn't just what you paid upfront, but how much service the asset delivered.
What the CSIRO benchmark means
CSIRO's GenCost analysis estimates an equivalent cost of approximately AUD 45–77 per megawatt-hour for a 60-year solar-PV project that includes a complete rebuild in the second half of its life. That converts to 4.5–7.7 cents per kilowatt-hour and is approximately 5% lower than a single 30-year project, because development and network-related costs are spread over more generation (CSIRO GenCost 2024–25).
The second major capital investment is still required. This isn't evidence that the original panels operate indefinitely without substantial spending, nor is it a rooftop installation quote.
CSIRO also cautions that rooftop-PV cost data represent broad Australian market averages. A household should calculate its own result using its installation cost, expected output, refurbishment schedule, financing and terminal expenses.
Separate production cost from household value
| Measure | What it answers |
|---|---|
| Panel-system LCOE | What does producing electricity cost over the modelled life? |
| Avoided retail purchases | What is electricity worth when used at home instead of imported? |
| Export income | What does the retail plan pay for electricity sent to the grid? |
| Whole-household result | What remains after tariffs, supply charges, storage costs and other expenses? |
Shading and generation affect production cost. Tariffs and self-consumption primarily affect the value recovered from that production. Mixing those concepts can make an apparently precise LCOE misleading.
A low LCOE doesn't necessarily mean cheap panels. It may reflect strong lifetime output or a longer operating horizon. It also isn't a retail bill: a panel-generation calculation doesn't automatically include household retail charges, export income or battery expenditure.
Compare your model with the applicable tariff using our Australian electricity price per kWh guide. Don't assume today's tariff or any recent Australian electricity pricing trend will continue unchanged throughout the system's life.
End-of-Life Costs and Repair, Reuse or Replacement Decisions
Most payback calculators concentrate on purchase price, electricity savings and inverter replacement. Removal, transport and disposal need their own allowance rather than an assumption that somebody else will handle them.
Australian parliamentary material estimated that approximately 60,000 tonnes, or 3 million panels, would reach end of life in 2025, with more than 90,000 tonnes annually projected by 2030. The same material describes a $24.7 million recycling pilot with up to 100 collection sites, illustrating why future collection arrangements could differ from today's assumptions (Australian parliamentary solar-panel end-of-life material).
The graphic highlights the difference between operating payback and complete ownership cost.
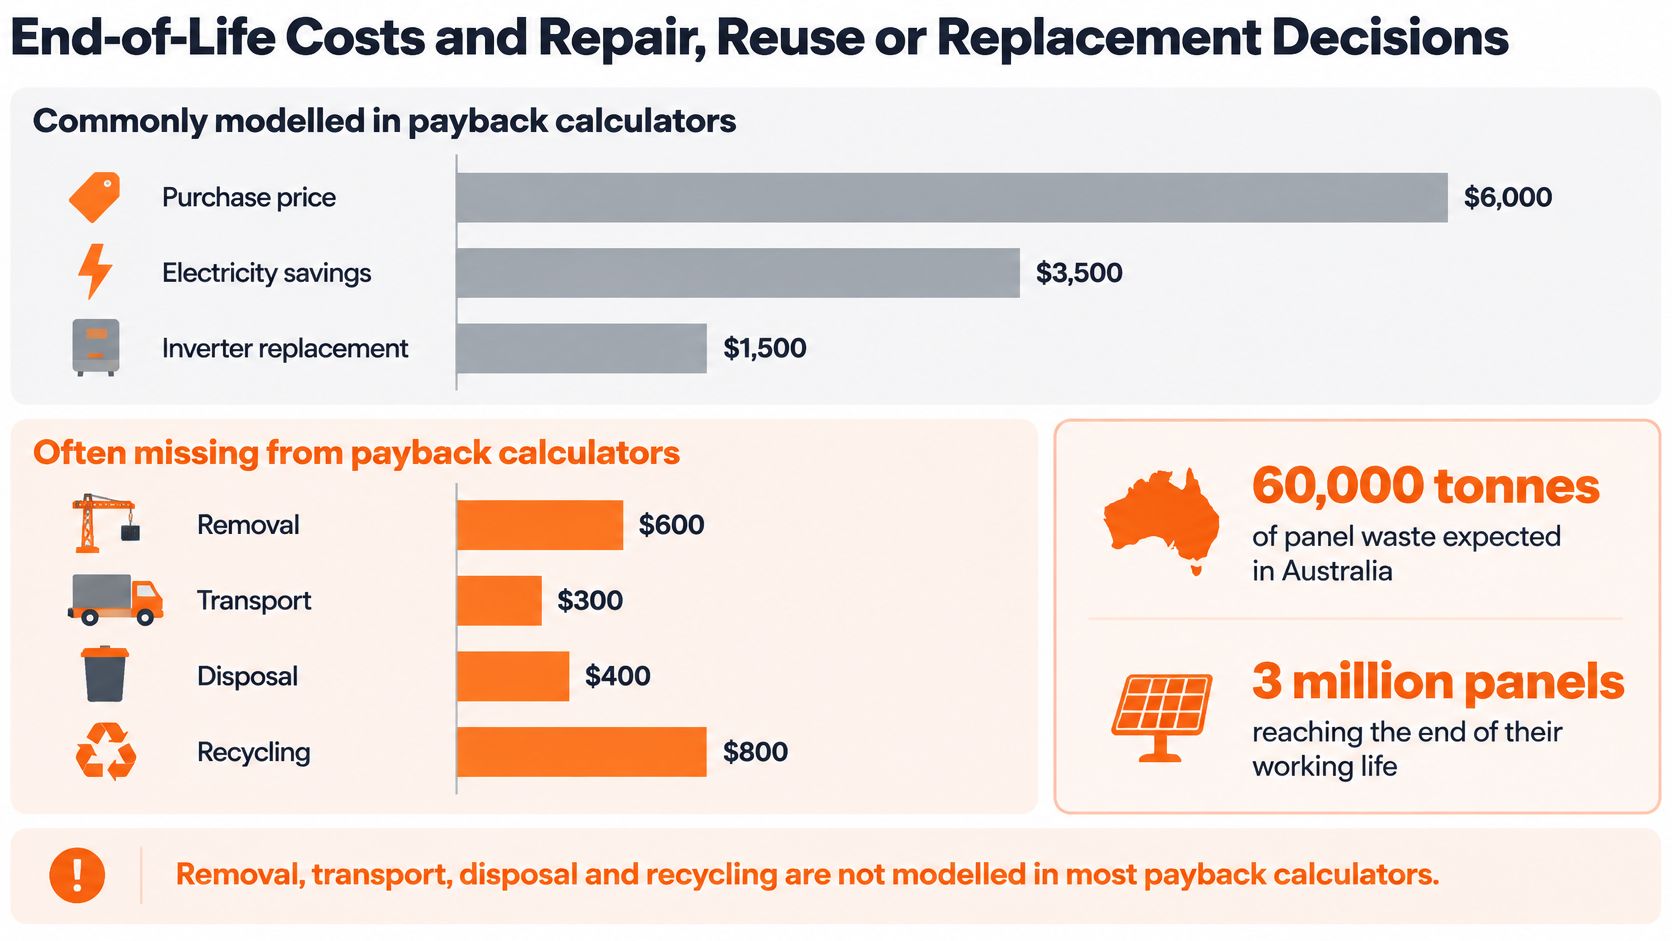
Different estimates measure different services
The estimates below come from separate studies and reporting contexts. They shouldn't be averaged into a national disposal price.
| Cost point | Per panel (AUD) | Source and context |
|---|---|---|
| Landfill, scoping estimate | About $2 | UNSW-led Australian Centre for Advanced Photovoltaics scoping material |
| Landfill, national estimate | About $4.50 | University of Sydney estimate |
| Household moving a panel to landfill or recycler | Up to $38 | ABC reporting on household handling |
| Recycling, scoping estimate | About $10–20 | UNSW-led scoping material, before recovered-material revenue |
| Recycling, national estimate | About $28 | University of Sydney estimate |
| Recycling, Queensland trial, metropolitan | About $43 | Trial estimate including collection and transport |
| Recycling, Queensland trial, remote | About $80.50 | Trial estimate including remote collection and transport |
The UNSW-linked research also estimates recycling at approximately AUD 500–1,000 per tonne before recovered-material revenue, with transport and facility costs important contributors (UNSW on solar-panel recycling economics). Its processing-oriented estimates aren't interchangeable with delivered household collection costs.
The University of Sydney's comparison puts recycling at approximately six times the landfill cost under its assumptions (University of Sydney solar-waste analysis). ABC reporting describes household totals of approximately $250–$650 depending on panel count, alongside the moving-cost estimate shown above (ABC reporting on household solar-waste costs).
Those household totals aren't a ceiling for remote collection. A Brisbane quote shouldn't be carried across to regional Queensland or NSW without checking transport, access and destination charges.
Budgeting rule: Confirm whether the price covers roof removal, collection, transport and processing. Don't add separate transport charges to a quote that already includes them.
Choose the pathway before pricing disposal
Keep operating where safe and economically useful. Review remaining generation, faults and inverter condition. Being below the original rating isn't, by itself, a reason to discard working modules.
Where only part of the array needs attention, assess selective repowering. Continued use of structurally sound racking may avoid unnecessary replacement, but compatibility and labour still belong in the comparison.
Evaluate reuse selectively, particularly where a local recipient can limit logistics. Don't assume a low second-hand purchase price creates a low installed cost. The parliamentary material cited approximately $4,500 annually for a reused system above 101 kW in one large-system scenario, not a household benchmark.
Replace when condition, safety or the overall economics justify it. Include removal and the documented destination of every retired component. Structural concerns require assessment rather than a financial assumption that the existing mounting remains suitable.
The accompanying video provides further context for the solar-waste discussion.
Landfill can look cheaper privately because disposal prices don't capture all environmental costs or recovered-resource value. Recycling becomes a different proposition when transport is consolidated or take-back arrangements change who pays.
Keep module composition records, proof of ownership and written take-back terms. Treat future stewardship fees or producer-funded collection as scenario variables, not guaranteed savings from the announced pilot.
Worked Payback Example for a 6.6 kW Queensland System
Consider an illustrative Queensland household assessing a 6.6 kW system with approximately 18 panels of around 370 W each. These are scenario assumptions, not a measured installation or customer case study. The panel count is approximate, so a real calculation should use the array's actual nameplate capacity.
Using the ABS benchmark and the Queensland trial rates already identified, the method is:
Establish initial capital. Multiplying the nominated system capacity by the ABS average produces an illustrative installed cost of approximately $10,146. This is a benchmark calculation, not an available offer or a post-rebate quote.
Enter inverter replacement as unknown. Obtain the replacement equipment, labour and timing assumptions for the actual installation. Don't substitute a guessed national allowance.
Enter maintenance as unknown. Add inspection, cleaning where required, repairs and monitoring costs. Keep planned servicing separate from uncertain fault expenditure.
Price the terminal pathway. Applying the metropolitan trial rate to the assumed panel count produces approximately $774. Applying the remote rate produces approximately $1,449. These are calculated scenarios using delivered recycling estimates, so check what's included before adding roof-removal or transport charges.
Build the generation forecast. Under the earlier constant-degradation assumptions, remaining output after the modelled period is approximately 88% in the low-loss case or 78% in the average case. Calculate each year's production rather than applying either endpoint to the entire operating life.
Why there's no honest payback date yet
Lifetime cost = initial capital + inverter replacement + maintenance + financing + end-of-life expenditure.
A simple cost-per-kWh estimate divides that total by expected lifetime generation. A formal levelised calculation also accounts for timing consistently.
Payback requires another calculation: annual avoided electricity purchases and export income, less operating expenditure. Without measured generation, household consumption patterns, tariff details and the missing cost allowances, there's no defensible payback year.
Decision test: A worked example should expose missing inputs, not conceal them behind a precise-looking savings figure.
For an owner who already has solar, the original purchase is also a sunk cost. The keep-or-replace decision should compare future incremental costs and benefits, rather than requiring the existing system to recover its purchase price again.
How a Battery and VPP Change the Lifetime Equation
Adding a battery changes the calculation, and it also adds a second asset with its own life cycle. Degradation, cycling, replacement cost and operating conditions belong in a separate column, not folded into the panel estimate. Storage analysis generally models the two independently for this reason: an improved bill outcome can mask the cost of the wear that produced it.
Self-consumption and controllable exports can raise the useful value of each kilowatt-hour generated. They do not make battery wear free.
Compare the value streams
| Arrangement | Financial mechanism | What to assess |
|---|---|---|
| Feed-in tariff | Payment for exported energy at the plan's applicable rate | Export timing, tariff conditions and network limits |
| Battery self-consumption | Stored electricity displaces later imports | Tariff difference, losses and cycling |
| Retailer-based VPP | Coordinated spare capacity supports grid participation and a retail offer | Allowance, eligibility, control settings and excess rates |
A Virtual Power Plant coordinates distributed batteries rather than treating each home as isolated storage. In a retailer-based structure, electricity supply and battery participation sit within the retail relationship, so the retail terms, not the wholesale market, determine what the household receives.
For a National Electricity Market assessment, weigh wholesale price volatility, demand events, peak pricing periods and network congestion. Export limits in Queensland and NSW remain explicit constraints. A model should not assume unrestricted discharge, or additional payment for grid stabilisation services that the contract does not provide.
Why HighFlow Energy uses existing assets
The Bring Your Own Battery VPP follows a defined process: you bring your existing solar and battery, the battery joins the VPP, spare capacity supports the grid only when the battery is available, and you receive a monthly bill-free electricity allowance. Household energy use is always prioritised, the VPP operates automatically in the background, and no new hardware is required. Eligible batteries must meet minimum usable capacity, inverter requirements and VPP compatibility standards.
The allowance covers the daily supply charge, electricity usage within the confirmed monthly amount, and network and distribution charges on that portion. Current tiers range from 300 kWh up to 1,000 kWh per billing month, depending on solar and battery system size. There is no fixed contract term and no exit fee for the Bill-Free Electricity offer while you remain eligible and stay with HighFlow Energy.
Assess the trade-offs alongside battery optimisation:
- Operating eligibility: If the battery stops working or is removed and eligibility ends, the allowance stops and standard retail pricing applies unless you leave.
- Excess consumption: Electricity used above the monthly allowance is charged at standard rates, with no penalties.
- Contract changes: Prices and terms may change where energy laws permit, with notification and the ability to leave without penalty.
- Warranty protection: Include cycling and manufacturer operating requirements in your assessment. Do not assume VPP participation is automatically covered by every battery warranty.
The lifetime equation gains a revenue line here, but the cost side still includes battery degradation and the possibility of replacement within the panels' remaining life. Model both.
Frequently Asked Questions
What is solar panel life cycle cost?
It's the complete cost of owning a solar system from purchase through removal. Assess it alongside lifetime generation, with separate allowances for refurbishment, maintenance and end-of-life handling rather than relying only on installed price.
How long do solar panels last before output falls too far?
There isn't a universal financial expiry date. The degradation scenarios discussed earlier show declining output, but the decision depends on safety, remaining generation, compatibility and the cost of maintaining the system versus replacing it.
What does it cost to recycle a solar panel in Australia?
The Australian estimates above differ because they measure different services and locations. Processing-only prices shouldn't be compared directly with delivered collection costs. Obtain an itemised local estimate, especially for regional or remote properties.
Do payback calculators include end-of-life costs?
Many focus on purchase price, electricity savings and inverter replacement. Check the actual inputs. If removal, transport and the disposal pathway aren't explicit, add them rather than assuming they're included elsewhere.
Does a battery change the panel life cycle cost?
It changes the combined investment calculation and the value recovered from solar generation. Keep the battery's degradation, replacement and cycling costs separate so improved bill outcomes aren't confused with lower panel production costs.
How does a VPP differ from a feed-in tariff?
A feed-in tariff pays for exported electricity. A retailer-based VPP coordinates battery participation under a retail offer. In our model, household use takes priority and only available spare capacity supports the grid.
Confirm Your Lifetime Cost Before You Decide
Key takeaways
Installation price isn't lifetime cost. Degradation changes generation, while end-of-life logistics change expenditure. A single payback figure can conceal both uncertainties.
Request the assumptions that determine the result:
- Degradation: The selected rate and its effect on annual output.
- Inverter replacement: Equipment, labour and expected timing.
- Terminal allowance: Removal, collection, transport and processing inclusions.
- Take-back arrangements: Who accepts the panels and who pays.
For an existing battery owner, the next question is whether the asset is delivering sufficient value through household use and eligible grid participation. That's a performance assessment, not automatically a reason to replace hardware.
Our offer is designed for homeowners in Queensland and New South Wales who have solar and a compatible battery, still receive electricity bills and want better value from their existing investment. Joining requires a compatible solar system, a compatible internet-connected battery and no new hardware.
Current Bill-Free Electricity allowance tiers range from 300 to 1,000 kWh per billing month, depending on solar and battery system size. Eligibility and the confirmed allowance determine the applicable benefit.
HighFlow Energy is an electricity retailer offering a Bring Your Own Battery VPP to help eligible households improve the financial return from existing solar and storage. Visit HighFlow Energy to request an eligibility assessment, review your current electricity performance and assess whether your battery is underperforming financially.