

Why Is My Gas Bill So High in Australia
At 31 March 2025, estimated annual residential gas bills on median standing offers exceeded median market-offer bills in every region assessed by the Australian Energy Regulator State of the energy market 2025 retail chapter, by 17% in the Australian Gas Networks South Australia region to 34% in the Allgas Energy Queensland region. That single comparison reframes Why Is My Gas Bill So High. You can burn the same gas and pay far more because of plan type, daily charges and network costs. For Queensland and New South Wales households, the useful question isn't only how much gas the meter recorded. It's which part moved, the megajoules, the price per megajoule, the days billed, or the fixed charge you pay to stay connected.
What a High Gas Bill Is Actually Charging You
An Australian gas bill splits into two charges, and only one of them listens when you turn an appliance down. The Australian Energy Regulator's guide to understanding your energy bill reports median annual residential gas bills of approximately $707 in Queensland and $936 in New South Wales for 2024-25 among households without rebates. The same guide sets out the structure behind those totals: a variable usage price measured in cents per megajoule (MJ) plus a fixed charge for supplying the property, regardless of consumption.
The fixed share is easy to size. A daily supply charge of $1 adds about $365 a year before a single megajoule is burned, and at $1.50 a day it reaches roughly $548. Measured against those median bills, the fixed slice is large enough that no change in shower length will erase it. That arithmetic explains why a careful household can still feel the bill is wrong. Cut your usage and you reduce MJ. The connection days keep charging regardless.
Check in one line: Bill before discounts is roughly (billing days x daily supply charge) + (MJ used x usage rate).
Copy Four Numbers Before You Judge the Total
Pull this bill and the last one side by side. Copy the meter-read dates, billing days, daily supply rate and total MJ from each. Each number answers a different question. A longer period gives the supply charge more days to accumulate. An estimated read means the MJ figure may not reflect what the meter recorded. A changed rate means identical habits produce a different total.
The comparison only works with two complete statements, not one total remembered from memory. Where older statements sit behind a lost login or inside a financial app, services such as AI2Fin restore options exist to recover access to those records so the comparison runs on real figures.
The same line-by-line habit applies to the electricity account, which bills supply and usage separately and needs its own diagnosis rather than a guess borrowed from the gas bill. HighFlow Energy's billing accuracy guide applies that approach on the electricity side.
What Moves With the Meter and What Doesn't
What each part of an Australian gas bill does
| Component | How it is charged | Typical scale | Falls if you use less gas |
|---|---|---|---|
| Daily supply charge | Fixed amount each day connected | About $1 to $1.50 a day, roughly $365 to $548 a year | No |
| Usage charge | Cents per megajoule metered | MJ used multiplied by the c/MJ rate on your plan | Yes |
| Billing-period length | Supply charge times number of days | A longer read adds more daily charges | No, unless days are wrong |
| Estimated read | Retailer estimate until an actual read | Can over or under state true MJ | Only if the estimate was high |
| Network and pipeline costs | Embedded in retail tariff | Built into the supply and usage rates you pay | Only partly |
| Discounts concessions and GST | Applied after or within billed amounts | Can hide or reveal the true rise | No |
Read the last column first. Rows marked No can lift your bill while your heater stays off. Rows marked Yes are the only ones where shorter showers, lower thermostat settings or a more efficient hot-water system change the result. Reducing consumption lowers the variable portion and leaves the daily connection cost untouched. A mild month can still produce a stubborn bill, and comparing only the headline total tells you almost nothing about which component moved.
How to Tell Price from Usage on Your Bill
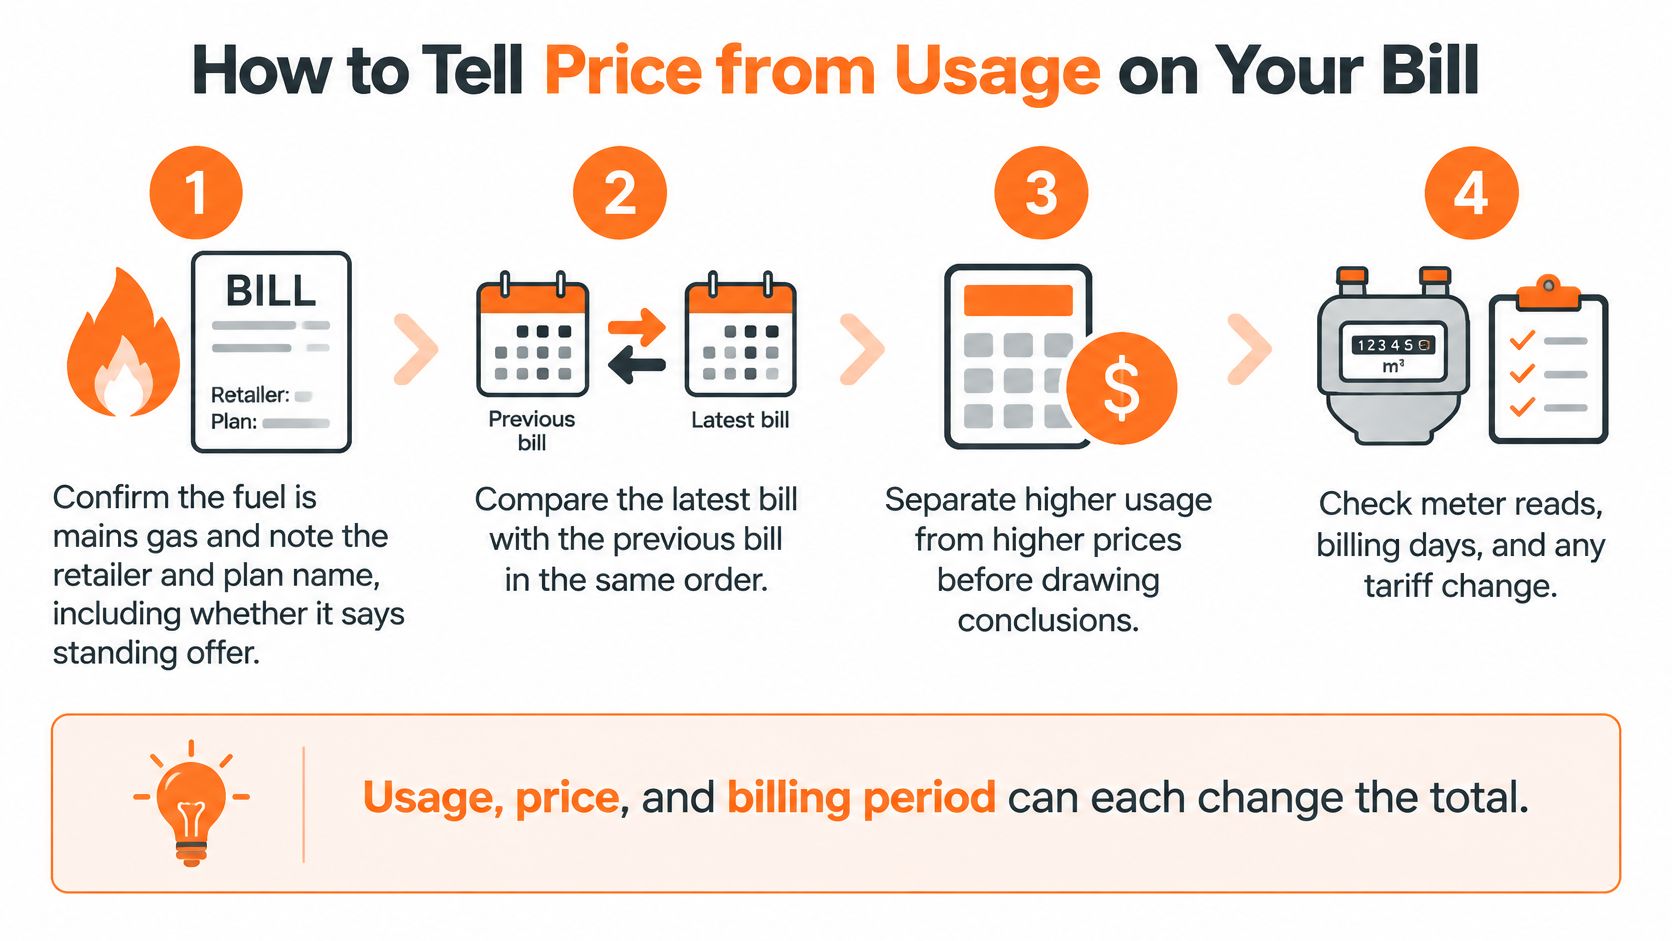
Don't start by calling a gasfitter or switching retailer. Start by separating price from usage on paper. The sequence below takes about ten minutes with two bills and a calculator, and it stops you fixing the wrong problem.
The visual summary below sets out the order. Work through it top to bottom rather than jumping to the total.
The Eight Checks in Order
- Confirm the fuel and plan: Check the bill is for mains gas, then note the retailer and plan name, including whether it says standing offer.
- Count the days: Subtract the meter-read dates. Divide the total by billing days so a long quarter isn't mistaken for a rate rise.
- Compare total MJ: If MJ is flat but dollars are up, look at price, fixed charges, fees or a missing discount, not your behaviour.
- Compare each rate separately: Put the daily supply rate beside last bill's, then do the same for the cents per MJ rate.
- Check actual or estimated: A catch-up bill after several estimates can look like a sudden spike when it's really delayed billing.
- Look for missing credits: Find concession, rebate and discount lines. An expired concession card removes money you were used to seeing.
- Confirm the tariff fits the meter: In New South Wales and Queensland, check you're on the correct gas tariff and don't confuse a controlled arrangement on a combined energy account with gas.
- Recalculate: Billing days times supply charge, plus MJ times usage rate. Whichever term grew most explains the gap.
Plan type deserves its own warning because it's invisible in daily life. Nothing in your home changes when a market offer expires and you roll onto a standing offer. The flame looks identical. Only the rate changes. That's why step one matters as much as the meter reading. Our explainer on gas smart metering covers how meter data supports these checks, but the diagnosis works with a standard accumulative meter too, provided reads are actual.
If MJ per day is steady and dollars per day jumped, you're looking at a pricing problem, not a usage problem. Don't book a plumber for a tariff change.
Match Your Pattern to a Cause
What your gas bill pattern usually means
| Signal on the bill | Usual cause | First check |
|---|---|---|
| Dollars up, megajoules similar | Supply rate, usage rate or plan changed | Compare c/MJ and daily supply with the previous bill |
| Megajoules up sharply | More heating, hot water, occupants or a fault | Match MJ to weather, occupancy and appliance runtime |
| Read marked estimated | Bill not based on an actual meter read | Request an actual or special read |
| More days than last period | Extra daily supply charges | Divide the total by days before comparing |
| Plan says standing offer | Default price above many market offers | Compare with a current market offer in your network |
| Concession or discount missing | Rebate expired or not applied | Check card dates and the concession line |
| High bill in warm weather | Hot water, supply charge or a leak | Separate hot-water use from space heating |
| One-off extra fees | Special read, late payment or other account fee | Match fees to the retailer's fee schedule |
Let the row decide your next move. A pricing row points to the retailer and a plan comparison. A usage row points to appliances, weather and the building. Mixing the two wastes money, because a new heater won't fix a standing offer and a new plan won't fix a leaking hot-water valve.
Appliances, Climate and the Building Driving Usage
A rise in MJ per day has three domestic drivers: appliances convert gas into heat, weather decides how much heat is needed, and the building decides how much of that heat escapes. The useful split is efficiency, load and leakage. The home below shows where that heat is made and where it gets out.

Efficiency Decides How Much Gas Each Degree Costs
Energy Safe Victoria guidance on Type B appliance energy efficiency identifies typical efficiencies ranging from below 70% for atmospheric boilers to 80 to 83% for induced-draught, 85 to 90% for forced-draught, and up to 98% for condensing boilers when operating in condensing mode. Those figures describe Type B equipment, so apply them as a principle rather than a rating for a domestic heater: an ageing, poorly maintained appliance burns more gas for identical comfort.
Rank loads before spending money. Gas hot water usually runs all year and dominates in warmer months. Space heating dominates winter in cooler parts of New South Wales and inland Queensland. Cooktops and dryers sit well behind both for most households, so blaming the stove rarely explains a large jump. An electricity battery cannot offset these megajoules either; it sits on a different meter and a different account.
Four checks cost nothing:
- Set heating sensibly: Keep winter heating around 18 to 20 degrees and avoid deep overnight setbacks that force long recovery burns in the morning.
- Trim hot water: Shorter showers and full laundry loads reduce MJ, though only the variable charge responds.
- Read the rating label: Compare the appliance energy rating and annual MJ figure against what your bills show.
- Watch runtime: If the heater or hot-water unit runs far longer without colder weather or extra occupants, something has changed mechanically.
Burner tuning can improve efficiency by up to 2% on the equipment in that guidance, which tells you tuning alone won't rescue a doubled bill. It is maintenance, and it is licensed work. A licensed gasfitter should service older heaters and hot-water systems, check sizing and controls, and test for faults. Don't open a gas appliance yourself.
Climate Sets the Load Before You Touch a Dial
The Australian Bureau of Statistics Household Energy Consumption Survey reported that households in climate zones 6 and 7 consumed about 950 MJ of mains gas per week on average, around 45% and 42% above the national average respectively. Over a year, 950 MJ per week equates to approximately 49,400 MJ. Later regulator bill estimates point the same way qualitatively: colder gas states tend to record higher household gas use and higher annual bills.
Compare like with like. Put this winter's MJ per day against the same months last year, then adjust mentally for a colder snap, a new baby, or guests staying over. A neighbour comparison fails because insulation, heater type, orientation and household size all differ behind a similar facade. A cold-climate example such as the Big Bear home heating savings guide is useful only for the physics of sealing and maintenance; Australian outcomes still depend on local climate zones, network charges and the plan attached to your meter.
The short video below walks through common household heating losses. Treat it as a prompt for what to inspect; your MJ figures remain the evidence.
When the Building Is the Problem
Draughts, thin ceiling insulation and unsealed exhaust fans force a heater to replace heat that has already left. Seal door gaps, close off unused rooms, and fix failed door seals before blaming the retailer. Renters cannot reinsulate a ceiling, but they can report draughts, failed heaters and hot-water faults to the agent in writing and ask for repair. Keep copies. If paying becomes difficult, ask the retailer about hardship support early rather than after arrears build.
This is also where tariff discipline matters. Cutting shower time lowers the usage component, while the daily supply charge keeps accruing each billing day. A leaner house can reduce MJ and still face a firm bill because part of the account never met the heater.
Safety line: Gas smell, hissing near pipework, dead vegetation near the meter, or a meter index moving with every appliance off means stop diagnosing. Leave the area, avoid switches and flames, then call the gas emergency line and a licensed gasfitter.
That safety check is the one exception to bill-first diagnosis. Everything else starts with MJ per day.
Network Costs, Wholesale Gaps and Common Misconceptions
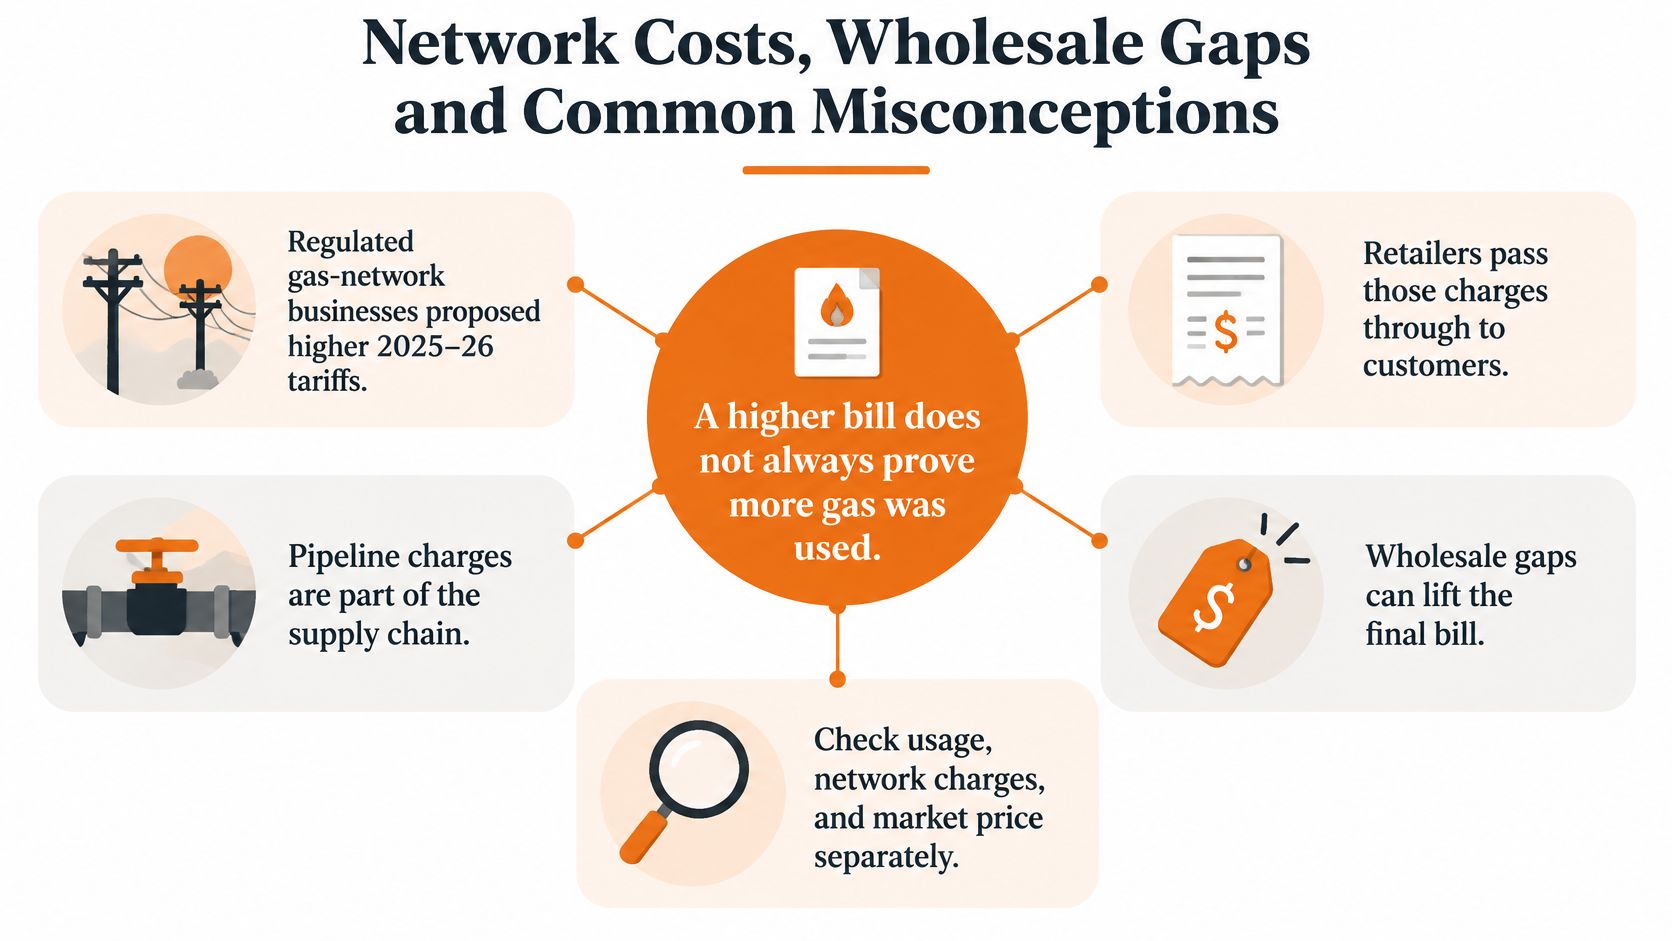
A higher bill doesn't prove you used more gas. Much of what you pay sits upstream of your meter, in pipelines, distribution networks and retail contracts you never see itemised. The map below separates those layers.
The Part of the Bill You Cannot Switch Off
The Australian Energy Regulator notice on 2025-26 gas network tariff variations says all regulated gas-network businesses proposed higher 2025-26 tariffs, driven by inflation, regulated returns and other adjustments, and retailers pass these underlying charges into retail prices. The AER also reports that pipeline charges make up roughly 40% of a residential gas bill. Eastern-Australian residential gas bills reached about AU$2 billion in FY2023-24, while wholesale gas costs had contributed to a 44% increase in total eastern-Australian residential gas bills since FY2014-15.
That structure breaks the simple conservation promise. Use less gas and your bill falls, but not proportionally, because fixed and network-related costs keep rising on their own schedule. A household that cuts MJ during a network tariff increase can end the year paying almost the same and wrongly conclude the savings effort failed.
Wholesale headlines mislead in the opposite direction. The ACCC gas inquiry September 2025 interim report reported average producer prices under long-term contracts in the first half of 2025 fell 2% to $13.12 per gigajoule compared with the second half of 2024, while average retailer prices increased 9% to $14.33 per gigajoule. Contracts, transport, network costs, operating expenses and margins sit between the producer and your meter. A falling producer price is not a promise about your next bill.
Broader price data points the same way. The Australian Bureau of Statistics monthly consumer price index indicator for July 2025 reported gas prices increased 4.7% in the 12 months to July 2025, and rose 6.2% in July alone, attributed to July 2025 price reviews reflecting higher operating costs. Price reviews land on set dates. Your usage doesn't have to change for the bill after a review to rise.
Five Misconceptions That Send People the Wrong Way
Housing quality sits underneath several of them. An Energy Consumers Australia report on understanding and measuring energy hardship reports around one in five Australian households are vulnerable to or experiencing energy hardship, and renters spend about 8% more on electricity than comparable homeowners after accounting for net wealth, likely reflecting poorer insulation and less efficient appliances. Older Australian homes are estimated to average only 1.8 stars for energy efficiency. That electricity figure doesn't measure gas, but the building defects behind it, draughts and poor insulation, raise gas heating demand too.
- Shorter showers will fix it: They trim MJ only. They don't touch the daily supply charge or network costs embedded in your tariff.
- A high summer bill proves invented usage: It doesn't. Hot water runs all year, fixed charges continue, and an estimated read can catch up in any season.
- My neighbour pays less, so my meter is wrong: Different star ratings, heater types, orientations and household sizes make raw comparisons unreliable. Compare your own same-season MJ per day.
- Wholesale prices fell, so my bill should fall: Retail prices include transport, networks and margins, and contracts delay any pass-through.
- My battery should offset gas: It can't. A home battery, feed-in tariff and Virtual Power Plant Australia participation optimise grid electricity. Solar export doesn't heat gas hot water and doesn't rewrite a gas tariff.
Concessions add one more layer worth checking. South Australia's winter gas concession, described on the energy.gov.au winter gas concession page, provides 17.5% of domestic mains-gas usage and service costs between 1 May and 30 October each year, calculated after retailer discounts are deducted. That's a South Australian rule, not a national one. New South Wales and Queensland readers should check their own state rebate rules and confirm the credit appears on the bill, because an expired concession card can look exactly like a price rise.
Frequently Asked Questions About High Gas Bills
Why Is My Gas Bill So High When I Used Less Gas
Because only part of the bill follows the meter. The daily supply charge applies every day the property stays connected, and network costs sit inside your tariff, so cutting usage lowers the variable MJ charge only. A longer billing period or a rate review can outweigh your savings entirely.
Is a High Gas Bill Always a Leak
No. Most high bills trace back to billing days, changed rates, estimated reads or winter heating. Still, check the meter index with every appliance off. A moving index, gas smell or hissing is a safety issue, and you should leave and call the gas emergency line rather than investigate further yourself.
Does a Home Battery Lower My Gas Bill
No. Battery storage, solar export and Bring Your Own Battery virtual power plant participation affect your electricity account only. They don't change your gas supply charge, your cents per MJ rate, or the gas your hot-water system burns. Treat the two accounts as separate diagnoses with separate fixes.
Why Do Standing Offers Cost More
A standing offer is the default plan you sit on when you're not on a competitive market offer, and default pricing is rarely the sharpest available. If your bill names a standing offer, compare current market offers for your gas network before assuming an appliance fault. Same gas, different price, is a common pattern.
What If I Cannot Pay
Contact your gas retailer before the due date, not after a disconnection notice arrives. Ask about hardship support, a payment plan, and any state rebate or concession you may be missing. Retailers must discuss assistance options with customers in hardship, and early contact gives you more of them.
When Should I Go to the Energy Ombudsman
After you've raised a complaint with your retailer and it hasn't resolved the issue. Keep both bills, your rate comparison, read type and dates, and any retailer responses. An ombudsman case built on MJ per day and printed rates resolves faster than one built on a feeling that the total looks wrong.
Who to Call and Whether Your Battery Earns Its Keep
Order matters. Work through this sequence and stop at the step that matches your evidence.
- Safety first: Gas smell, hissing, or a meter moving with appliances off means leave, avoid switches and flames, call the gas emergency line, then a licensed gasfitter.
- Billing errors to the retailer: An estimated read, days that don't match the meter-read dates, or maths that doesn't match printed rates goes to your gas retailer. Request an actual read and a review of supply charge, usage rate, fees and concessions.
- Genuine usage jumps to a gasfitter: If MJ per day sits well above the same season last year after a fair weather check, book a licensed gasfitter for the heater or hot-water unit. Renters should put the fault in writing to the landlord or agent.
- Standing offers to a comparison: If rates explain the rise, compare current market gas offers for your network before spending on appliances.
- Payment trouble to hardship support: Ask your gas retailer for a payment plan and concession check now. Waiting shrinks your options.
Fixed daily charges accrue with no use at all. The same MJ can cost more when network and retail prices rise. Efficiency and the building drive winter MJ. Electricity products don't rewrite a gas tariff.
That last point leads to a separate decision for Queensland and New South Wales homes with solar and a compatible battery. HighFlow Energy was started because many households invested in solar and home batteries expecting much lower electricity bills, but those bills never fully went away. We don't sell panels or batteries. As an electricity retailer, we fund a bill-free electricity allowance using value generated by our Virtual Power Plant, covering daily supply charges, electricity usage within the allowance, and network and distribution charges on that allowance, while your household use stays prioritised. There's no fixed contract term and no exit fee for the Bill-Free Electricity offer, and the allowance continues while you remain eligible and stay with us. Usage above the allowance is billed at the excess rate in your Energy Plan, bills still issue even at $0, and no specific outcome is guaranteed. Our guide to solar battery payback helps you judge whether your battery earns its keep before you assess eligibility. Most battery owners focus on installation quality. Far fewer focus on ongoing performance.
If your gas diagnosis is settled and the electricity account is the remaining problem, HighFlow Energy can assess whether your existing solar and battery system qualifies for retailer-based virtual power plant participation with a monthly bill-free electricity allowance. Request an eligibility assessment, review the plan terms against your actual usage, and decide on evidence rather than another season of unexplained bills.