


Battery Charge Rate Explained for Australian Homes
At 1:15pm on a bright Australian summer day, your rooftop solar may be producing more power than the house can use. The air conditioner cycles on and off, the inverter sends surplus energy towards the battery, and the battery app shows a charging figure in kilowatts. That number is your battery charge rate, but it doesn't tell you whether the system is charging at the most valuable time.
For homeowners in New South Wales and Queensland, the practical question has changed. It's no longer only, “How fast can my battery charge?” It's also, “When should it charge, who controls that decision, and what value does the stored energy create?” Battery charge rate now sits inside a wider decision involving solar production, household demand, time-of-use pricing, export limits, wholesale volatility and retailer-led Virtual Power Plants.
What Battery Charge Rate Means in a Real Australian Home
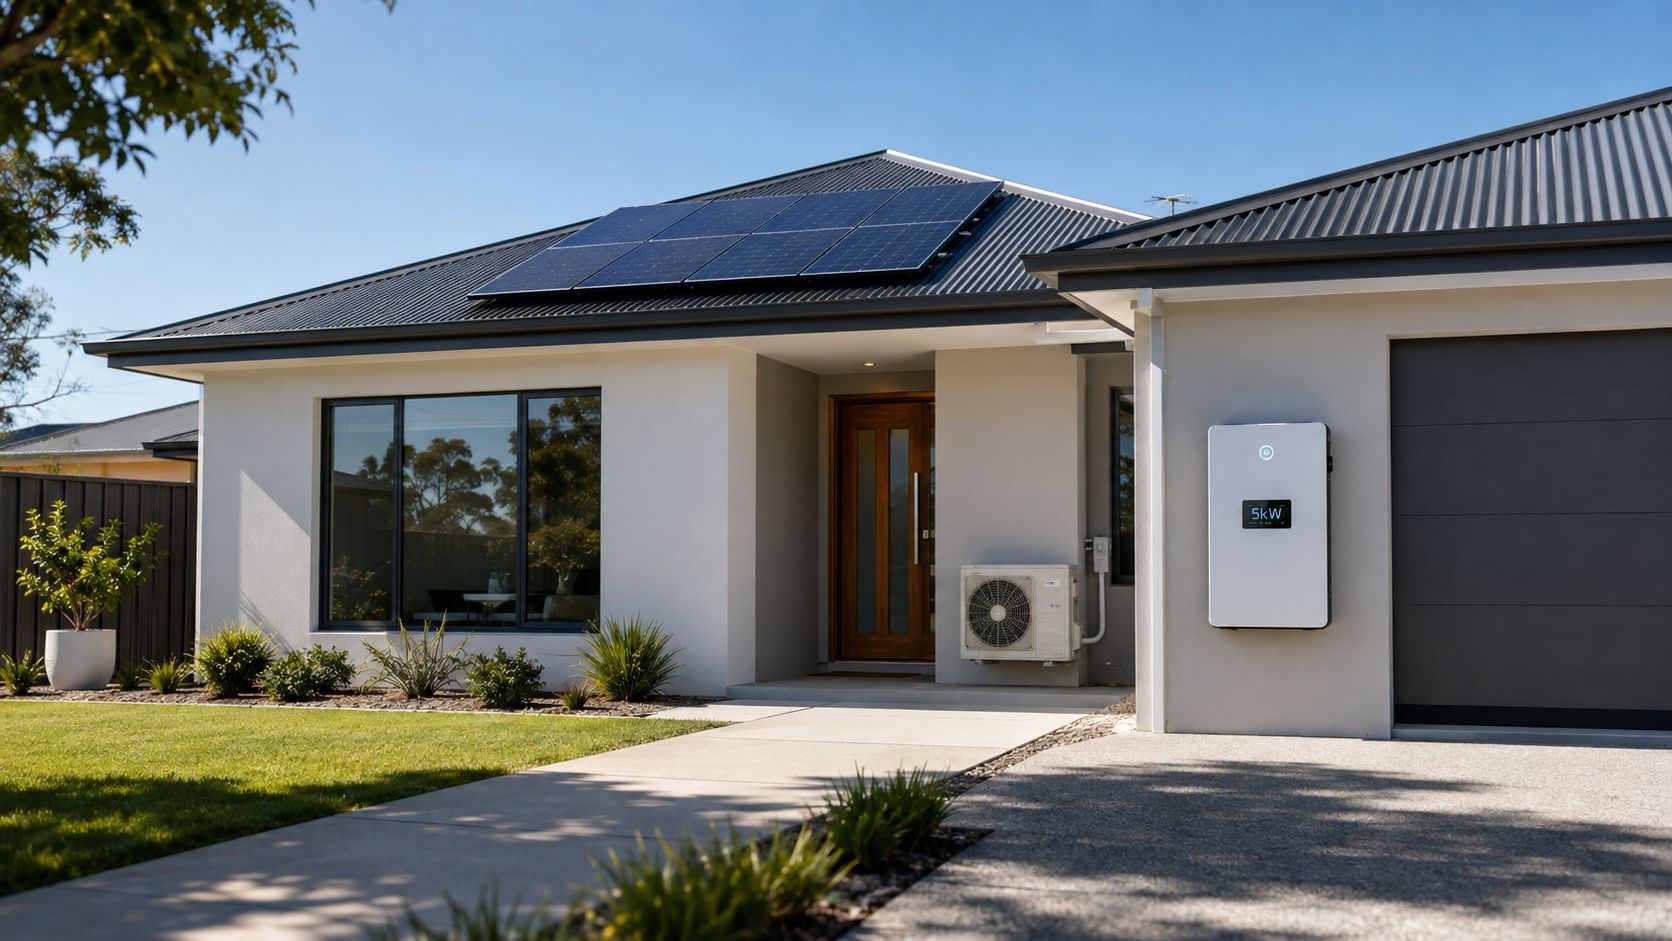
On a sunny afternoon in Adelaide, a home may have solar generation available, an air conditioner switching on and a battery taking in the remaining energy. If the battery displays 5 kW, the system is directing energy into storage at five kilowatt-hours for each hour that rate continues.
Kilowatts, or kW, measure charging speed. Kilowatt-hours, or kWh, measure capacity. Capacity is the amount of energy the battery can hold. Charge rate is the size of the flow entering it, much like the width of a pipe filling a tank.
A larger battery does not automatically charge faster. Its permitted charging power depends on the cell design, battery management system and inverter. The inverter can set a lower ceiling than the cells could technically accept, particularly when controls limit heat or respond to a network export constraint.
The home decides whether speed matters
A standard 10-amp domestic outlet typically delivers about 2 kW, while a dedicated home wall charger can deliver around 7 kW, according to the Australian Government home charging calculator. The comparison illustrates the difference between a slower and faster energy flow. A home battery usually charges through a solar or hybrid inverter, not a household plug.
In practice, the battery may not need to accept every available kilowatt. Household appliances can use part of the solar output, storage can take another part, and the remainder may be exported. A higher charge rate has more value when solar production rises quickly, surplus energy would otherwise be curtailed, or a retailer-led VPP is preparing the battery for a later event.
The NEM price spread is also shrinking in some periods, which can reduce the value of charging as fast as possible. The more important question may be when the retailer schedules charging and who controls the stored energy, rather than the maximum rate shown on the specification sheet.
Practical rule: Compare the battery's continuous charge rate with the inverter's solar output and your household's midday surplus. Storage size alone cannot show how much available solar the system can capture.
Charge rate is a live operating variable, not a fixed promise. Weather, appliance demand, tariff settings, battery temperature and retailer instructions can change it during the day. A higher-priced battery is not automatically a better fit if the inverter or network connection prevents the system from using its full charging capability.
Understanding C-Rate and How It Relates to kW
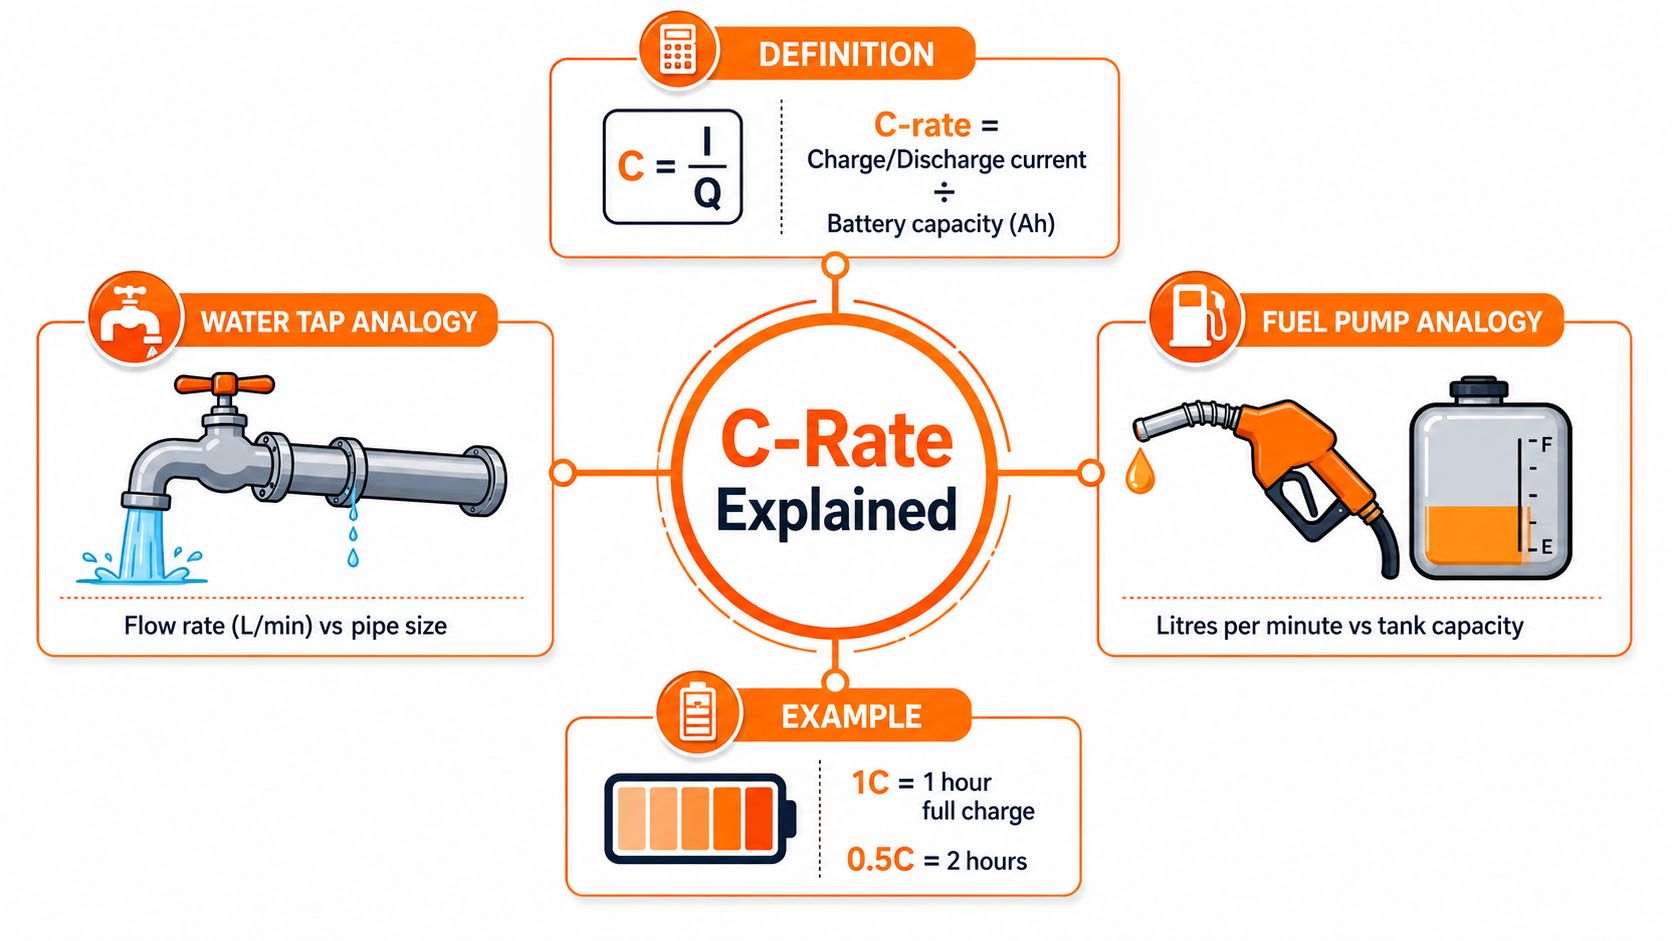
A C-rate compares a battery's charging or discharging power with its nominal capacity. The CSIRO batteries for homes guidance uses this measure to compare batteries of different sizes.
The basic relationship is:
Power in kW = battery capacity in kWh × C-rate
A battery operating at 1C can theoretically charge or discharge its full nominal capacity in about one hour. For example, a 10 kWh battery at 1C corresponds to roughly 10 kW. At 0.5C, the same battery corresponds to about 5 kW.
That calculation describes the battery's theoretical relationship, not necessarily the power available in a home. The inverter, software, temperature and battery management system may impose lower limits.
Two ways to understand C-rate
Battery capacity is the size of the storage tank, while the charge rate is the capacity of the pipe supplying it. A larger tank holds more energy, but a narrow pipe fills it slowly. A wider pipe can transfer energy faster, although the inverter, wiring and battery controls must be able to handle that flow.
The same principle applies to a fuel system. A tank's size corresponds to kWh, while the pump's litres-per-minute rating corresponds to kW. C-rate sets the pump speed relative to tank size, so it provides a fairer comparison between batteries with different capacities. Comparing output power alone can make a larger battery appear faster because it stores more energy.
The HighFlow Energy battery discharge rate guide applies this relationship to battery output, showing how capacity and C-rate determine available power.
The maths in practice
For a 10 kWh battery:
- 0.5C means approximately 5 kW, subject to the system's rated limits.
- 1C means approximately 10 kW, subject to the system's rated limits.
- A 1C rate represents roughly a one-hour full-capacity equivalent, while 0.5C represents roughly a two-hour equivalent.
A C-rate is a specification, not a guarantee that the system will sustain that output in every condition. The battery management system may reduce current as the battery approaches full charge, temperatures rise or manufacturer limits apply.
Higher C-rates reduce the time needed to transfer energy, but can increase thermal and electrochemical stress. For Australian homeowners, the relevant comparison is the manufacturer's specified continuous charge rate, rather than a short peak figure.
How Charge Rate Affects Performance and Battery Longevity
A battery that charges quickly can capture more solar during a brief midday peak. That sounds useful, but the result depends on the solar array, inverter capacity, household demand and export approval. A high theoretical charge rate cannot absorb energy that the inverter cannot route into the battery.
Charge rate also affects when stored energy becomes available. Faster charging may bring the battery to a useful state of charge before evening demand, leaving energy for household loads or a VPP event. Filling too early can reduce flexibility if solar continues later or market conditions change. With NEM price spreads shrinking and retailer-led VPPs becoming more common, the important question is increasingly who controls that timing, and what event the system is preparing for.
A higher rate buys time, not automatically more value.
Heat and cycling need equal attention
The battery management system monitors current and temperature, then adjusts operation within the system's limits. Sustained charging at a higher C-rate generally creates more heat than charging more slowly. The system may therefore reduce power to protect the cells. Ambient temperature, enclosure design and installation location all affect how much of the rated performance remains available.
Operating conditions also matter for warranty expectations. Manufacturer limits cover particular temperatures, charge rates, depth of discharge and control settings, so homeowners should compare continuous specifications rather than focus on a short peak figure. The AEMC information on virtual power plants provides useful context for how coordinated battery operation can affect household settings and participation conditions.
| Charge Rate vs Battery Outcomes | Charge Power | Full Charge Time | Thermal Stress | Relative Cycle Life |
|---|---|---|---|---|
| 0.5C | About half the nominal battery capacity in kW | Roughly a two-hour equivalent | Lower than a sustained higher rate | Depends on chemistry, temperature, depth of discharge and warranty conditions |
| 1C | About the nominal battery capacity in kW | Roughly a one-hour equivalent | Higher than 0.5C under comparable conditions | Depends on chemistry, temperature, depth of discharge and warranty conditions |
The table shows operating relationships, not guaranteed battery life. A battery may also lose energy during charging and discharging, so the energy sent into it will not equal the energy later available to the home. The guide to round-trip efficiency explains this difference and why it belongs in any charge-rate comparison.
For many homes, a balanced setting is more useful than the highest available rate. Moderate charging can absorb ordinary solar surplus while preserving room for later generation, evening demand or a retailer-scheduled VPP event. The best setting depends on whether the system is optimising self-consumption, responding to a tariff, or following an external dispatch signal.
Typical Charge Rates in Australian Residential Battery Systems
A household choosing a battery should read its capacity and C-class together. A 5 kWh battery at 0.5C has a nominal charge-rate relationship of about 2.5 kW, while a 10 kWh battery at 0.5C corresponds to about 5 kW. A 13.5 kWh battery at 0.5C corresponds to about 6.75 kW.
At 1C, those same capacities correspond to about 5 kW, 10 kW and 13.5 kW. These are calculations from nominal capacity, not a promise that the home will receive that power at the switchboard. The practical result depends on the battery, inverter, temperature, state of charge and control settings.
| Typical residential battery charge rates by capacity and C-class | 0.5C Charge Rate | 1C Charge Rate | Typical Real-World Limit |
|---|---|---|---|
| 5 kWh | About 2.5 kW | About 5 kW | Often constrained by inverter output, battery temperature and system controls |
| 10 kWh | About 5 kW | About 10 kW | Often constrained by inverter output, network settings and household demand |
| 13.5 kWh | About 6.75 kW | About 13.5 kW | Often constrained by inverter rating, battery management controls and export approval |
Read the whole specification
Product names such as Tesla Powerwall 3, BYD HVS and HVM, Enphase IQ Battery and Sungrow identify system families. They do not establish the charge rate of a particular installation. Model configuration, inverter pairing, firmware and local network approval determine what the system can do.
A datasheet may show a maximum charge rate, a continuous rate and a short-duration peak. These figures describe different operating conditions. For daily solar absorption and retailer-led VPP dispatch, the continuous figure is generally the more useful comparison because it describes sustained operation rather than a brief peak.
Thermal derating can reduce charging power in hot weather. The inverter may impose a separate limit, while the battery management system can lower the rate when cell conditions require protection. These controls are normal safeguards, not evidence that the battery is failing. They also matter as retailers increasingly decide when participating batteries charge, discharge or hold energy.
The inverter can be the bottleneck
A large battery paired with a lower-rated inverter will not charge at the battery's theoretical maximum. The reverse can also happen. An inverter may have more apparent charging capacity than the battery can safely accept, leaving the battery management system as the limiting control.
Ask the installer for three figures in writing:
- Continuous charge power, rather than only a peak figure.
- Inverter charging output, including any hybrid inverter limit.
- Conditions that trigger derating, such as temperature or state of charge.
This check prevents homeowners from paying for headline speed that the rest of the system cannot deliver. It also places charge rate in its proper context. In a tighter NEM price-spread environment, the useful question is often when the battery can charge, and who controls that schedule, rather than how fast it can fill.
Why NEM Wholesale Spreads Change the Value of Charging Fast
A home battery earns or saves money by shifting energy between times. It might store daytime solar, reduce household imports in the evening, or join a retailer-led VPP event. The value comes from the difference between the cost of charging and the value of discharging. Maximum kW is only one part of that calculation.
Australian battery fleets are changing the conditions around that decision. AEMO's Q2 2026 Quarterly Energy Dynamics reported peak battery charging of 3,653 MW on 7 June 2026, 29% above the previous record. Average battery charging in Q2 2026 was 87 MW higher than in Q2 2025.
More batteries are therefore charging during similar periods. When systems absorb surplus energy together, the opportunity to profit from that energy becomes more competitive. AEMO also recorded NEM-wide battery price spreads of about AU$51/MWh in Q2 2026, down from AU$342/MWh a year earlier. With less spread between charging and discharging values, batteries have less arbitrage headroom across the market.
Speed can fill the battery too early
A fast battery may reach its target state of charge before the most valuable discharge window begins. That can suit a household preparing for an evening peak or wanting backup energy. It can also leave too little room for later solar or a higher-value market event.
The AEMO Q1 2026 Quarterly Energy Dynamics report provides further context on changing battery conditions. Fast charging still has a practical role. The better question is whether that speed matches the home's needs and the schedule set by the retailer or VPP operator. Timing and control now matter more than speed in isolation.
Consider a sunny midday period with abundant solar generation. A battery that charges at a controlled rate can retain capacity for later solar, instead of filling as soon as energy first becomes available. That spare capacity can matter when export value is low or negative and another charging window is likely.
The retailer changes the operating equation
A standard electricity plan may reward self-consumption and pay a feed-in tariff for exported solar. A VPP can add another payment stream by coordinating battery capacity during demand events or other market opportunities. The household should check how the retailer values imported energy, exported energy, stored energy and participation.
A higher charge rate helps when the battery must absorb a defined amount of energy quickly. A lower or adaptive rate can preserve flexibility as wholesale conditions change. For many Australian homes, the practical priority is no longer filling the battery at maximum speed. It is ensuring the battery has energy, capacity and permission available when the household or retailer needs them.
How a BYOB VPP Schedules Charge and Discharge
A Bring Your Own Battery VPP, or BYOB VPP, connects an existing home battery to a coordinated operating platform. The homeowner retains ownership of the equipment, while the VPP operator uses available flexibility under agreed rules.
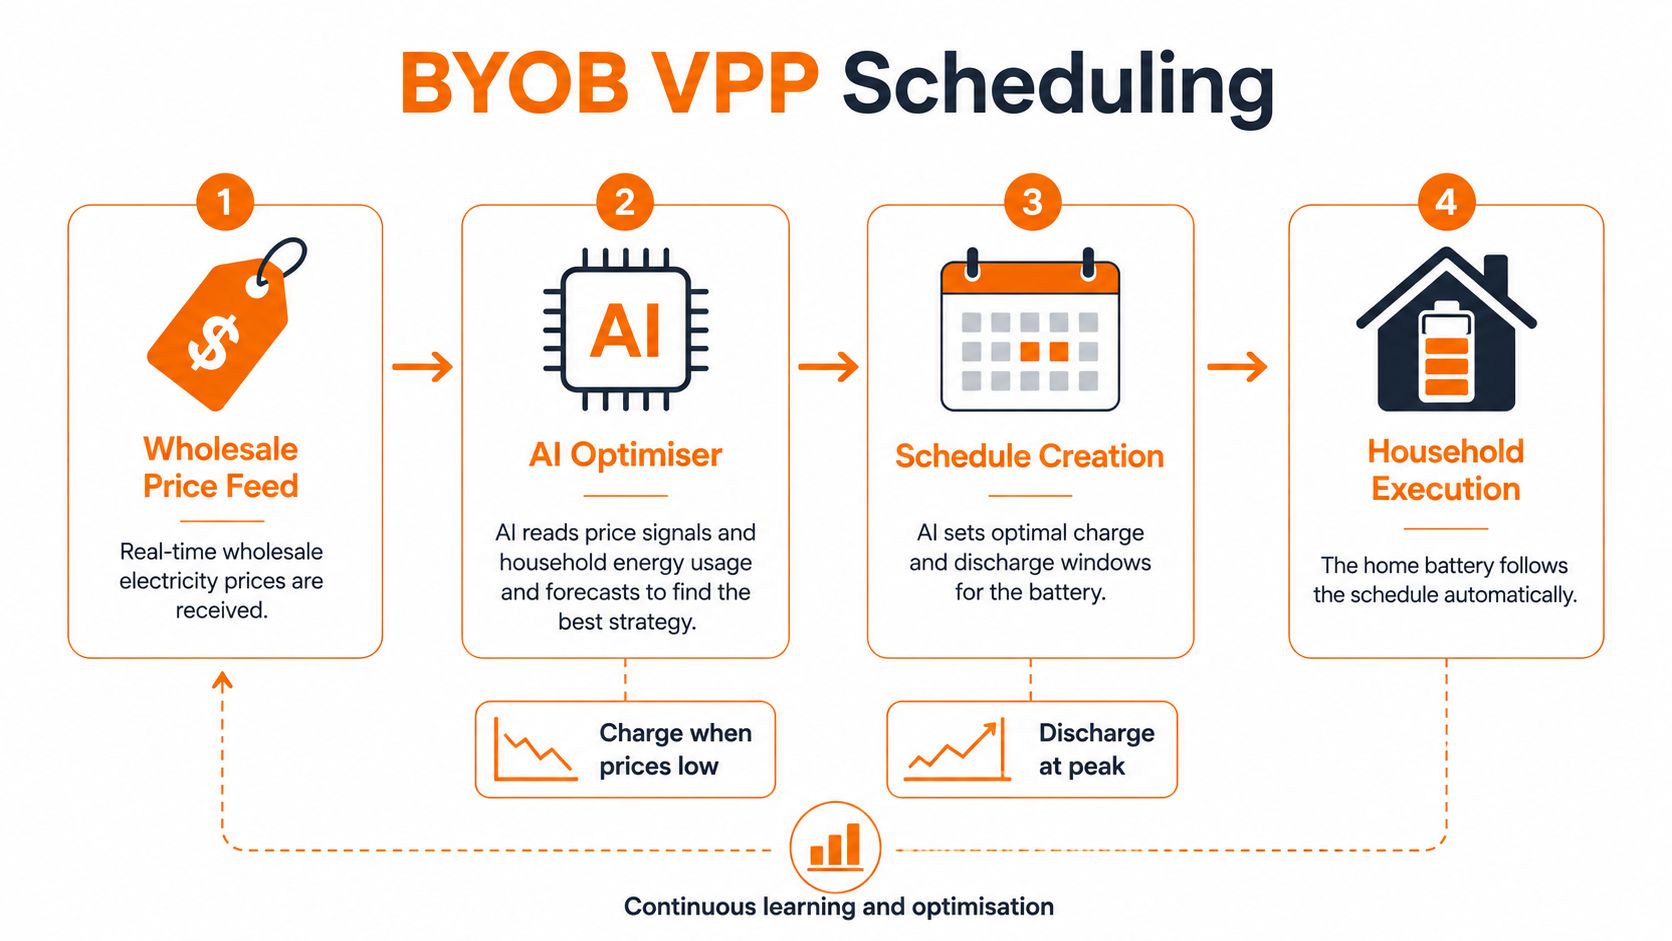
A retailer-led program such as HighFlow Energy can use market information, solar forecasts and household consumption patterns to create an operating plan. The plan doesn't need to run the battery at maximum charge rate. It needs to decide when charging or discharging creates sufficient value while preserving household priorities.
A typical scheduling sequence
The platform reads market conditions. It monitors relevant wholesale signals, tariff settings and potential demand events.
The optimiser reviews the home. It considers expected solar production, household consumption, current state of charge and the owner's reserve settings.
The schedule creates operating windows. The battery may charge when energy is lower-value or when solar surplus is expected, then discharge during a higher-value period or eligible VPP event.
The home receives priority. The schedule should respect a minimum reserve and any owner-defined requirements for evening use or backup.
The homeowner can override the plan. App controls should allow the owner to change the operating mode. A transparent program should also record overrides and battery activity so the customer can review what happened.
The battery state of charge guide explains the reserve concept that sits behind these decisions. A battery at a high state of charge has less room to absorb new solar. A battery held too low may not provide the backup or evening support the household expects.
Capacity-only programs and market-participating programs aren't identical. A program may pay for access to available battery capacity, while another may coordinate flexibility into wholesale or frequency control markets. The payment structure, dispatch frequency, customer controls and battery warranty treatment should all be clear before enrolment.
Australian VPP offers can include event payments of around $1 per kWh discharged to the grid, with credits often applied monthly or quarterly, and some plans list annual eligible volumes such as 250 kWh. These examples are documented in the Australian VPP comparison. They aren't universal terms, so customers should read the current offer rather than assume every VPP uses the same structure.
One AEMC dataset lists a 22.63 c/kWh grid charging credit for charging a battery before a grid event. The AEMC VPP offers data also places usage tariffs and feed-in tariffs alongside VPP terms, showing why the total retail plan matters.
Safety, Warranty and Network Export Considerations
A battery can charge quickly and still operate outside a sensible household setting. Safe operation depends on three controls working together: the battery management system, the product warranty and the local distribution network's export approval.
The battery management system monitors cell temperature and voltage. If either moves beyond its permitted range, the system can reduce current or stop charging. Installation must also meet Australian requirements for location, clearances and protection, including AS/NZS 5139. Ask the installer how the system manages heat and which conditions trigger derating.
Warranty documents deserve the same attention as the app's charge-power setting. Tesla, BYD, Enphase, Sungrow and AlphaESS products may set different conditions for throughput, operating temperature, depth of discharge and continuous power. Exceeding the specified charge limit can create a warranty dispute, even if the battery continues to operate.
| Warranty and network guardrails for faster charging | Typical charge warranty clause | DNSP export cap (common) | Risk of exceeding |
|---|---|---|---|
| Residential battery system | Check permitted charge power, throughput and operating conditions in the exact product warranty | Determined by the DNSP and approval, not by battery capacity alone | Thermal stress, reduced control headroom or a warranty concern |
| Hybrid inverter system | Check inverter and battery limits together | Set by the approved connection and local network settings | Charging or export may be curtailed |
| VPP-connected system | Check dispatch rules, reserve requirements and override rights | Export capability can constrain VPP operation | Missed event value or conflict with household settings |
Network rules are also changing. Energy Australia reports that a rule commenced on 11 May 2026, requiring distributors to set at least 10 kW export limits for small-scale distributed generation where technically feasible. That does not give every existing home the same limit. The DNSP still sets the connection conditions.
Export approval can limit how much power a home moves into or out of the network, including during retailer-led VPP events. Ask the installer or retailer to confirm the current approval, dispatch rules and any override rights. A larger battery or faster charger cannot bypass those network settings.
Communications matter during an outage. A practical backup checklist should include learn how to keep Wi-Fi on during outages with a small battery backup, because an app or retailer control platform cannot communicate normally if the home network loses power.
Practical Tips and App Settings to Optimise Charge Rate
A battery can charge at its maximum permitted rate and still deliver poor household value. The inverter app determines whether available solar fills the battery, serves household loads or moves to the grid. Open the relevant platform, such as Tesla, BYD, Enphase, Sungrow or AlphaESS, and review the controls for charging, reserve and operating mode.
Start with the four settings that matter most
Maximum charge power: Set the kW ceiling within the inverter, solar surplus and warranty limits. A lower ceiling usually suits ordinary daily solar. A higher setting has a clearer purpose when surplus would otherwise be constrained or a defined schedule requires it.
Backup reserve: Set the minimum state of charge you want available for an outage or evening arrival. A high reserve leaves less room for midday solar, while a low reserve provides less backup energy.
Operating mode: Self-use, peak shaving, time-of-use and market-based modes can produce different charging decisions. Choose the mode that matches your tariff, backup needs and willingness to let a retailer or VPP control the system.
Export control: Check whether solar serves household loads, charges the battery or exports first. The approved DNSP setting remains the governing limit.
The default setting is often a sensible starting point. Do not raise the rate because the app permits it. Increase it when the home regularly has surplus solar that would otherwise be curtailed, or when an agreed overnight or VPP schedule gives the extra power a clear job.
Align the battery with the tariff
Australian tariffs can differ substantially by retailer, state, distributor, plan and time window. Compare the actual peak, shoulder and off-peak periods shown on your bill with the schedule in the app. A tariff calculator can help estimate charging costs, but the battery should follow the plan you hold, not a generic clock setting.
The shrinking spread between cheap and expensive grid periods makes timing more important than speed alone. A fast charge may fill the battery before a useful solar or discharge period, leaving less room for later solar. Review the app logs and check whether the battery is charging when the tariff, solar forecast and household demand make that action worthwhile.
A retailer-led VPP can change the preferred period again. Its software may charge from the grid ahead of a forecast event, preserve a reserve for household use or discharge when market conditions support a response. The practical question is who decides, and whether you can see or override that decision.
Check the VPP agreement before enrolling
Ask the retailer:
- Household priority: Can the system preserve your chosen reserve and evening energy?
- Override control: Can you change the schedule immediately through the app?
- Payment basis: Are payments linked to capacity, energy discharged, grid charging or another allowance?
- Warranty treatment: Does dispatch stay within the manufacturer's continuous power limits?
- Export conditions: Does the program account for your DNSP approval and any dynamic export setting?
AEMO reported that household battery capacity under the federal Cheaper Home Batteries Program reached 11,321 MWh across 389,137 installations by the end of June 2026, up 41% from the end of Q1 2026. The figures appear in AEMO's Q2 2026 energy dynamics reporting. As more batteries enter coordinated programs, control rules, reserve settings and override rights matter as much as the hardware.
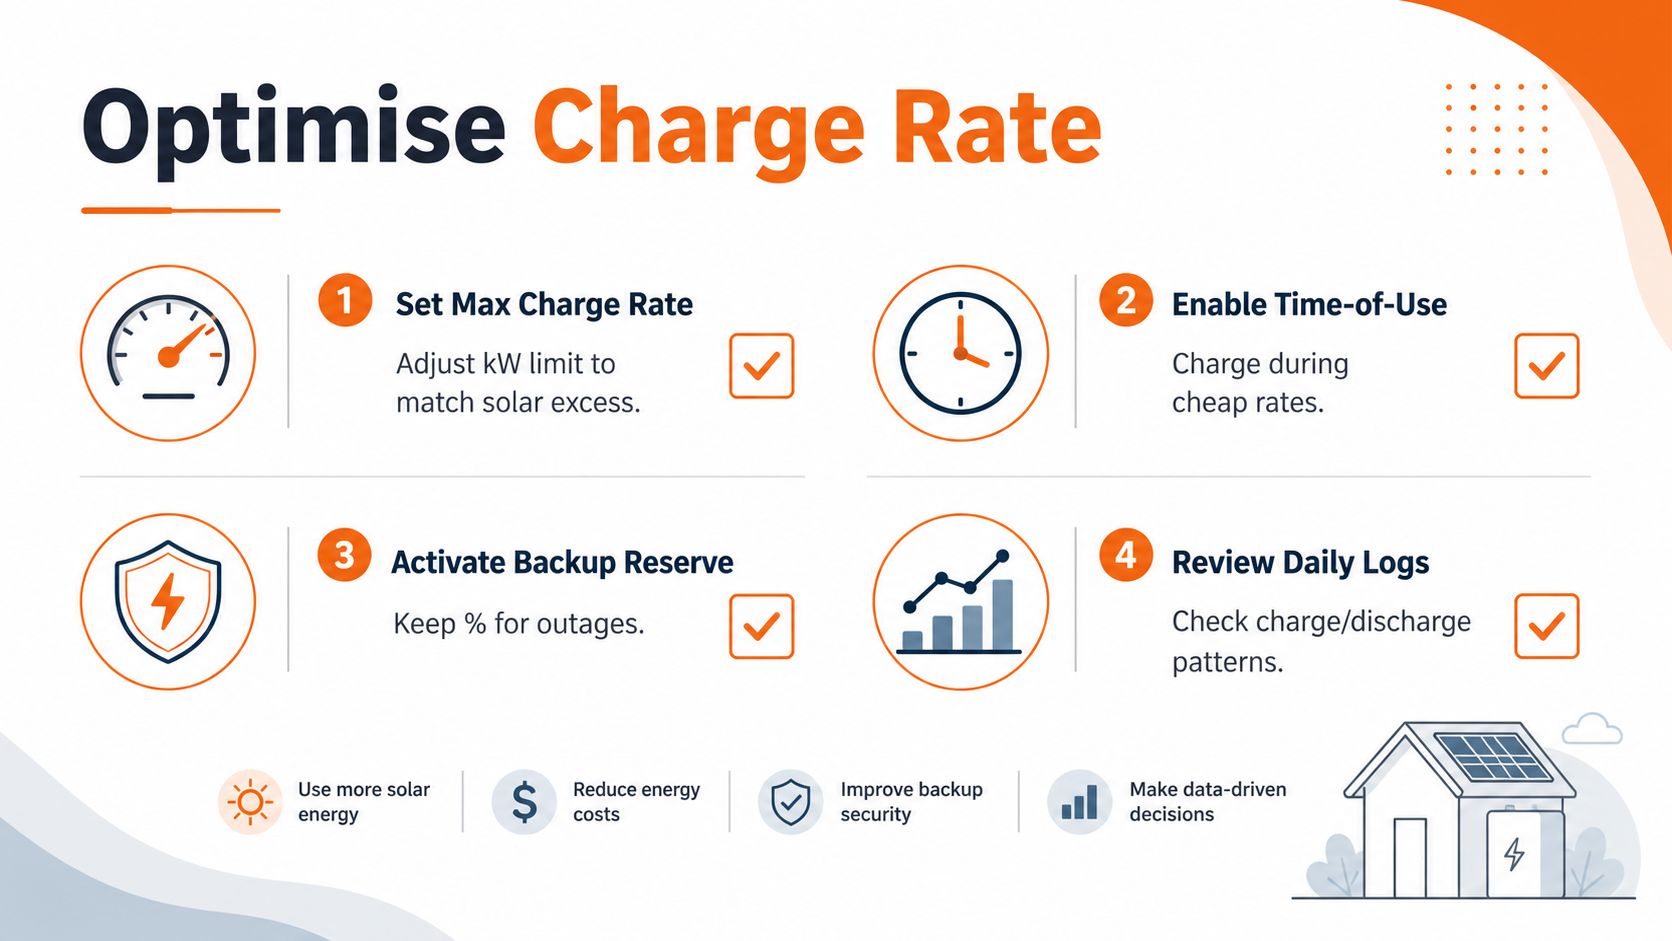
Review the system quarterly. Check charge and discharge patterns, temperatures, reserve behaviour and efficiency trends. Repeated thermal limiting or missed solar absorption is a reason to ask the installer or retailer to assess the settings before changing the rate yourself.
HighFlow Energy connects compatible existing solar and battery systems to a retailer-led BYOB VPP. The platform coordinates charge and discharge using market information while preserving household priority and app-based override control. Visit HighFlow Energy to check eligibility and assess whether your current charge rate and operating schedule are leaving value unused.