

Home Battery Comparison for Australian Homes That Pay Off
Australia's battery market has moved well beyond early adopters. More than 300,000 homes and businesses had a battery, representing about 8% of rooftop-solar properties, while 74,582 household batteries were installed in 2024 alone. The federal rebate then changed the buying calculation again, with 454,753 batteries installed by the end of 2025 and 183,245 units sold during the second half of that year. The Climate Council's battery market analysis and CHOICE's guidance on the current rebate show why a home battery comparison in 2026 can't stop at price or kilowatt-hours.
Whether a battery will generate enough value under your household's load profile, solar output, electricity tariff, warranty conditions and possible Virtual Power Plant participation is a key consideration. Queensland and New South Wales owners face different network conditions, demand patterns and programme options, so the same system can produce different financial outcomes in each state.
Why Home Battery Comparison Matters Right Now in Australia
185,798 home batteries were installed across Australia, according to Clean Energy Council figures. New South Wales recorded 14,686 installations, ahead of Victoria at 10,996 and Queensland at 8,555. The figures mark a shift from battery ownership as a niche solar upgrade to a material energy market. They also show why comparing systems requires more than checking the advertised storage size.
The federal rebate introduced in July 2025 changed the purchase calculation again. Reporting cited by CHOICE on home battery timing recorded 43,517 batteries installed in the first two months after the scheme began. By July 2026, the ACCC said more than 400,000 batteries had been installed across Australia in the previous 12 months. Rebate timing now affects demand, installer availability and the period required to recover the investment.
A battery can perform well technically and still deliver weak economic value. It may sit idle because the household has limited evening demand, export energy under restrictive network conditions, or cycle beyond the assumptions used in its payback estimate. The relevant output is the value created by each charge and discharge, after efficiency losses, degradation and warranty limits.
The comparison should therefore assess:
- Usable capacity, rather than nominal storage alone.
- Round-trip efficiency, which captures losses during charging and discharging.
- Cycle life and warranty limits, particularly when external dispatch increases battery use.
- Compatibility, including the existing inverter, meter and network connection.
- Retail value, including tariffs, feed-in returns and potential VPP allowances.
- Household priority, because grid participation must be weighed against access to stored energy when it is needed.
Queensland and New South Wales owners can face different network conditions, demand patterns and programme options. Those differences affect whether a battery gains more value through self-consumption, tariff shifting or participation in a Virtual Power Plant. A VPP may provide an allowance for dispatch during high-value periods, but that return must be compared with the feed-in revenue available from exporting the same stored energy.
Wholesale price volatility and demand events create opportunities for coordinated batteries, while adding operating constraints. A self-consumption configuration can retain more energy for evening use. A VPP arrangement can earn extra revenue, provided its reserve settings, dispatch rules and warranty treatment are clear.
Practical rule: Compare the battery as a revenue-producing asset, not as a box with a capacity label.
Early comparison table
| Decision factor | What to examine | Why it changes value |
|---|---|---|
| Storage size | Usable capacity | Determines how much energy can support the home |
| Efficiency | Round-trip efficiency | Shows how much energy is lost during a complete cycle |
| Durability | Cycle life and warranty terms | Sets the boundaries for long-term dispatch |
| Integration | Inverter, meter and network compatibility | Determines whether the system can operate as intended |
| Retail structure | Tariff, feed-in return and VPP terms | Influences the value of each charge and discharge decision |
| Control | Household reserve and dispatch rules | Balances bill reduction with backup and personal use |
Understanding Home Battery Specs That Affect Value
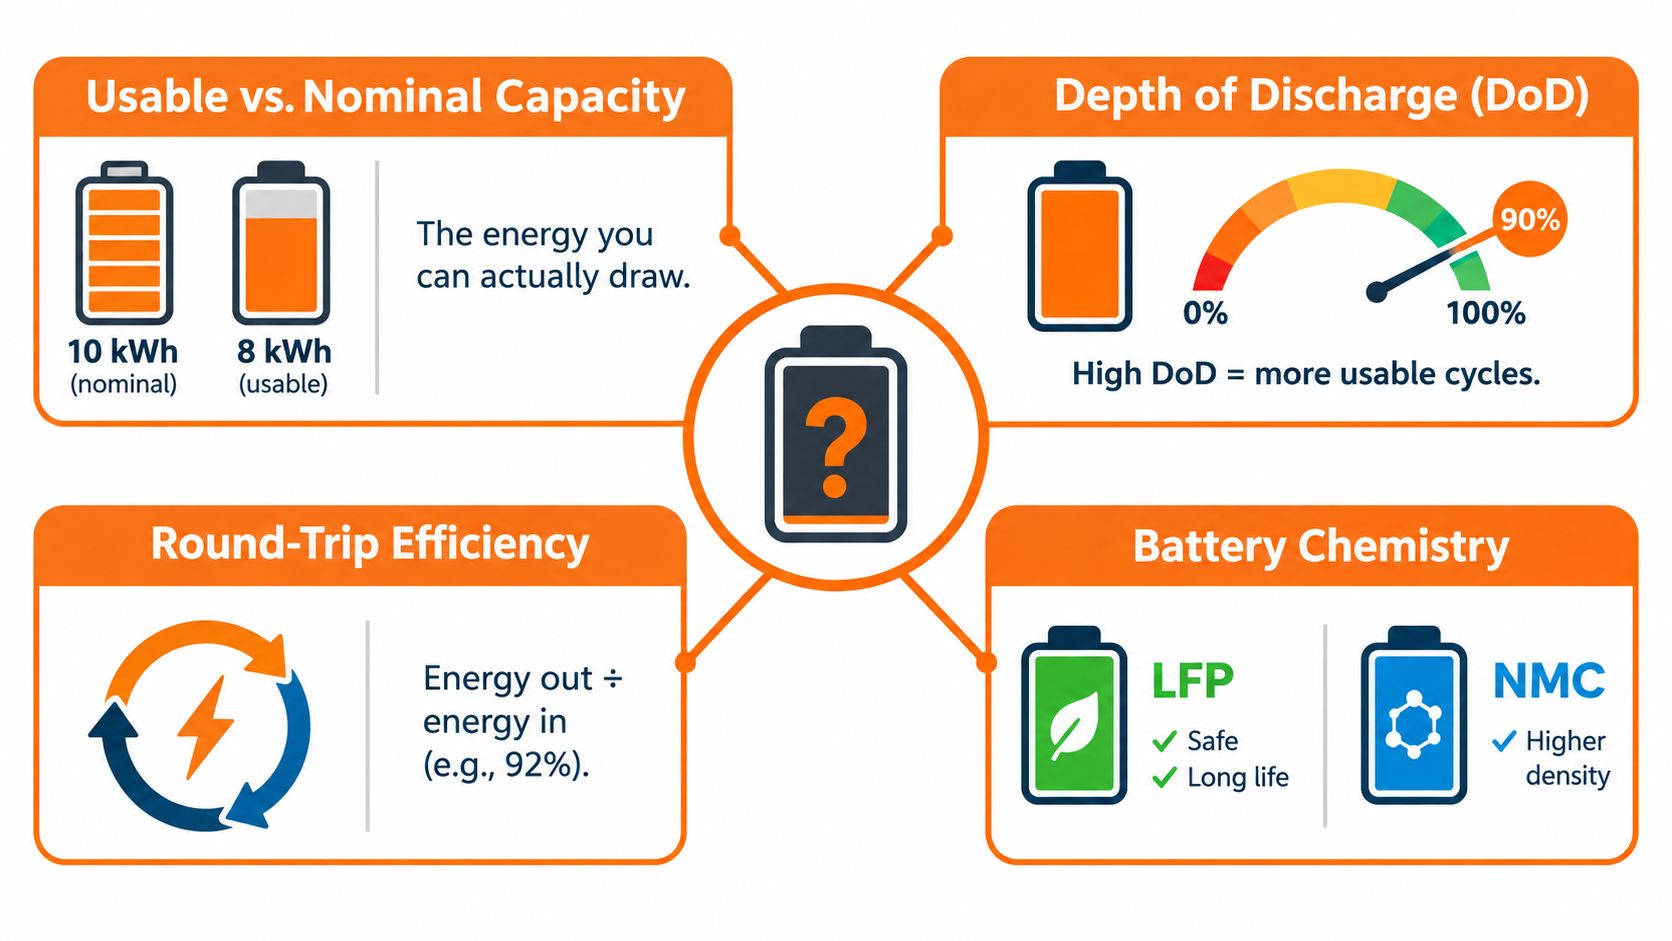
Battery specifications earn attention when they change usable energy, delivered output, degradation or revenue. Australian consumer guidance identifies usable capacity, depth of discharge, round-trip efficiency and cycle life as key comparison metrics in YourHome's battery information. These measures matter more than headline kWh when comparing total economic value under Queensland and New South Wales tariffs, feed-in returns and VPP arrangements.
Usable capacity comes before headline capacity
Nominal capacity is the battery's stated total storage. Usable capacity is the energy available after the system applies its depth-of-discharge limit. A larger nominal figure can therefore deliver less practical storage than a smaller system with a higher usable proportion.
Depth of discharge, or DoD, describes how much of the battery can be used during operation. A higher permitted DoD gives the household access to more installed storage, although warranty conditions determine whether that use is covered. Check permitted operating ranges, reserve requirements and throughput limits before comparing systems. Those terms influence how much cycling remains available over the warranty period and how much energy can be dispatched to reduce bills or earn VPP revenue.
A useful specification sheet shows both total capacity and the amount available for daily operation. Owners should also review the battery's discharge rate and practical output requirements. Storage volume alone cannot show whether the system can run several demanding appliances at once.
Efficiency converts stored energy into delivered energy
Round-trip efficiency measures the energy recovered after charging and discharging relative to the energy sent into the battery. It combines both stages, making it more useful for comparison than charging or discharging efficiency viewed separately.
Australian guidance notes that lithium batteries are typically above 90% efficient, as described in YourHome's explanation of battery efficiency. Higher efficiency reduces the solar or grid energy lost during daily cycling. The value becomes more material when the battery cycles frequently, particularly where stored energy would otherwise receive a feed-in tariff or qualify for a VPP allowance.
Cycle life connects usage to warranty exposure
Cycle life indicates how many full charge and discharge events a battery is designed to deliver before reaching its specified end-of-life condition. A VPP can change both the number and timing of dispatch events, so owners should confirm that the warranty permits this use and whether it imposes an energy-throughput limit.
The relevant comparison is whether the expected operating pattern fits the warranty, degradation assumptions and household objective. Conservative evening use creates a different profile from regular responses to wholesale price movements or grid support events. A lower purchase price may offer weaker value if degradation reduces usable capacity or warranty limits restrict profitable cycling.
Detailed Comparison of Leading Home Battery Systems
The strongest systems don't all compete on the same attribute. Some prioritise high efficiency, some offer substantial stackable capacity, and others provide a familiar single-unit format that may suit households seeking a straightforward installation.
The following figures come from the Australian market guide BatteryIQ's 2026 battery comparison. They should be treated as comparison points, not as a complete purchasing recommendation. Actual system design depends on the inverter, installation configuration, operating limits and warranty documentation.
Home Battery Efficiency and Scalable Capacity Comparison
| Battery System | Usable Capacity | Round-Trip Efficiency | Maximum Scalable Capacity |
|---|---|---|---|
| Sungrow SBR | Not specified in the cited comparison | Greater than 97% | Up to 102.4 kWh |
| BYD HVM | Not specified in the cited comparison | At least 96% | Up to 66.2 kWh |
| Tesla Powerwall 3 | 13.5 kWh | About 89% | 54 kWh |
The Sungrow SBR stands out in this comparison for its greater than 97% round-trip efficiency and up to 102.4 kWh scalable capacity. That combination may suit a larger home, a property with substantial solar generation or an owner considering coordinated operation across a wider energy load. The commercial question is whether the household can use the extra capacity often enough to justify the additional system cost.
BYD's HVM provides at least 96% efficiency and can scale to 66.2 kWh. It occupies a middle position in the table, pairing strong conversion performance with modular expansion. That can be useful where the owner expects consumption to change, although the final economics depend on how much capacity is installed initially and whether later expansion remains compatible with the original architecture.
Tesla Powerwall 3 offers 13.5 kWh of usable capacity, about 89% efficiency and a maximum scalable capacity of 54 kWh. Its lower efficiency in this comparison doesn't automatically make it a poor choice. A household may value its architecture, monitoring environment, output characteristics or installation pathway. The buyer should quantify the effect of energy losses rather than judging efficiency in isolation.
The key distinction: Higher efficiency reduces losses during repeated cycling, while higher scalable capacity supports larger loads and broader VPP participation. Those are related benefits, but they solve different household problems.
Efficiency becomes commercially important when the battery cycles frequently. Scalability matters when the system needs to absorb more solar, serve a larger evening load or participate in grid services without exhausting the household's reserve. The right choice is the one whose extra capability can be used under the owner's actual operating pattern.
Costs Warranties and Payback Under Australian Conditions
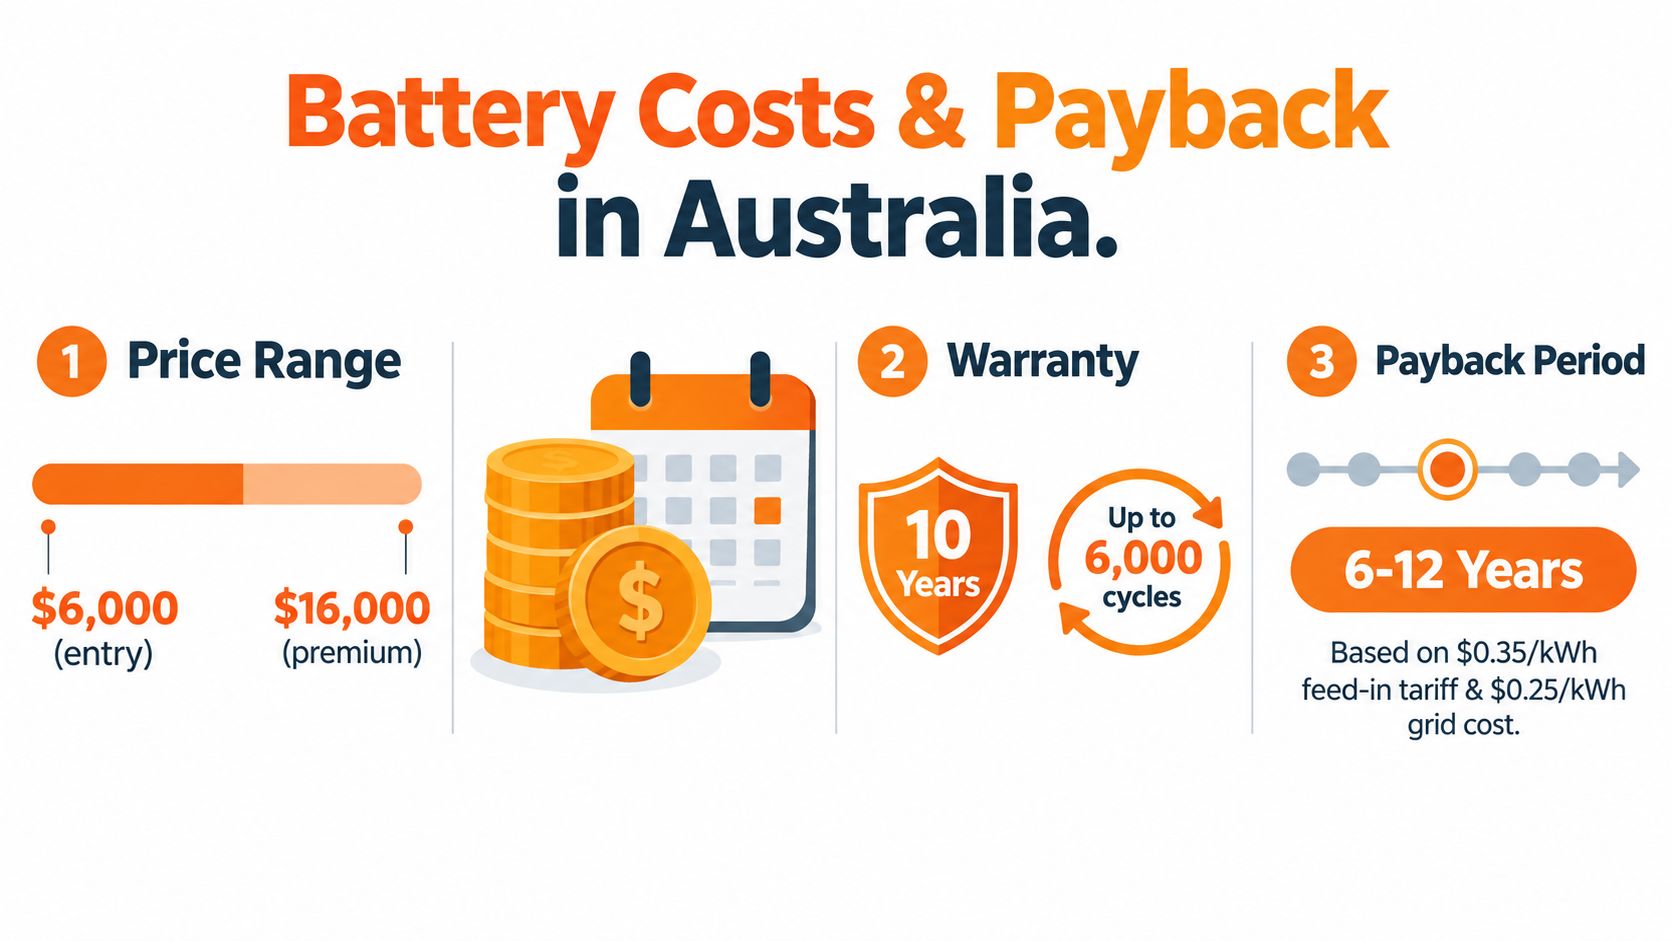
A battery can be affordable to install and still be difficult to finance through its operating returns. The AEMC says Australian buyers can choose from more than 70 batteries, with prices ranging from under $2,000 to nearly $20,000. That broad range makes sticker-price comparison unreliable because system architecture, installation scope, usable capacity and controls can differ substantially.
The same AEMC consumer analysis found average payback without subsidies was 14.5 years, falling to 7.3 years under the federal rebate. For a New South Wales battery owner who also joins a VPP, the analysis identified payback as low as 4 years. These figures aren't guarantees. They illustrate how policy and grid participation can alter financeability.
Payback is a use-pattern calculation
A self-consumption-only model earns value by replacing electricity that would otherwise be bought from the grid. A VPP model may add revenue or an allowance for making some battery capacity available during selected grid events. The second model can improve returns, but it also exposes the battery to a different dispatch profile.
A finance assessment should separate:
- Energy substitution, the value of using stored solar instead of importing electricity.
- Export value, the return available when energy is sent to the grid.
- Grid-service value, which may arise through VPP coordination.
- Operating cost, including the economic effect of degradation and warranty limits.
- Household reserve, the value of retaining energy for evening use or backup.
Owners comparing the economics of their system can use High Flow Energy's solar battery payback resource as a starting point, then test the result against their own interval consumption and tariff.
Rebates improve the entry calculation, not every outcome
The rebate lowers the initial capital burden, but it doesn't remove the need to compare system quality, warranty protection and dispatch conditions. A cheaper battery with limited usable capacity may deliver less practical value than a higher-performing system that costs more but cycles efficiently and integrates cleanly with the existing solar installation.
Extra cycling deserves careful attention. VPP participation can increase financial returns, yet the owner should confirm:
- Whether the warranty covers VPP operation.
- Whether the manufacturer applies a throughput ceiling.
- How the operator protects a household reserve.
- Whether participation rules can change.
- How the allowance or payment is calculated.
- What happens if the customer exits the programme.
The most useful question isn't “What's the cheapest battery?” It's “Which system can produce acceptable value after rebates, losses, degradation and permitted cycling?”
Installation Compatibility and VPP Performance in Queensland and New South Wales
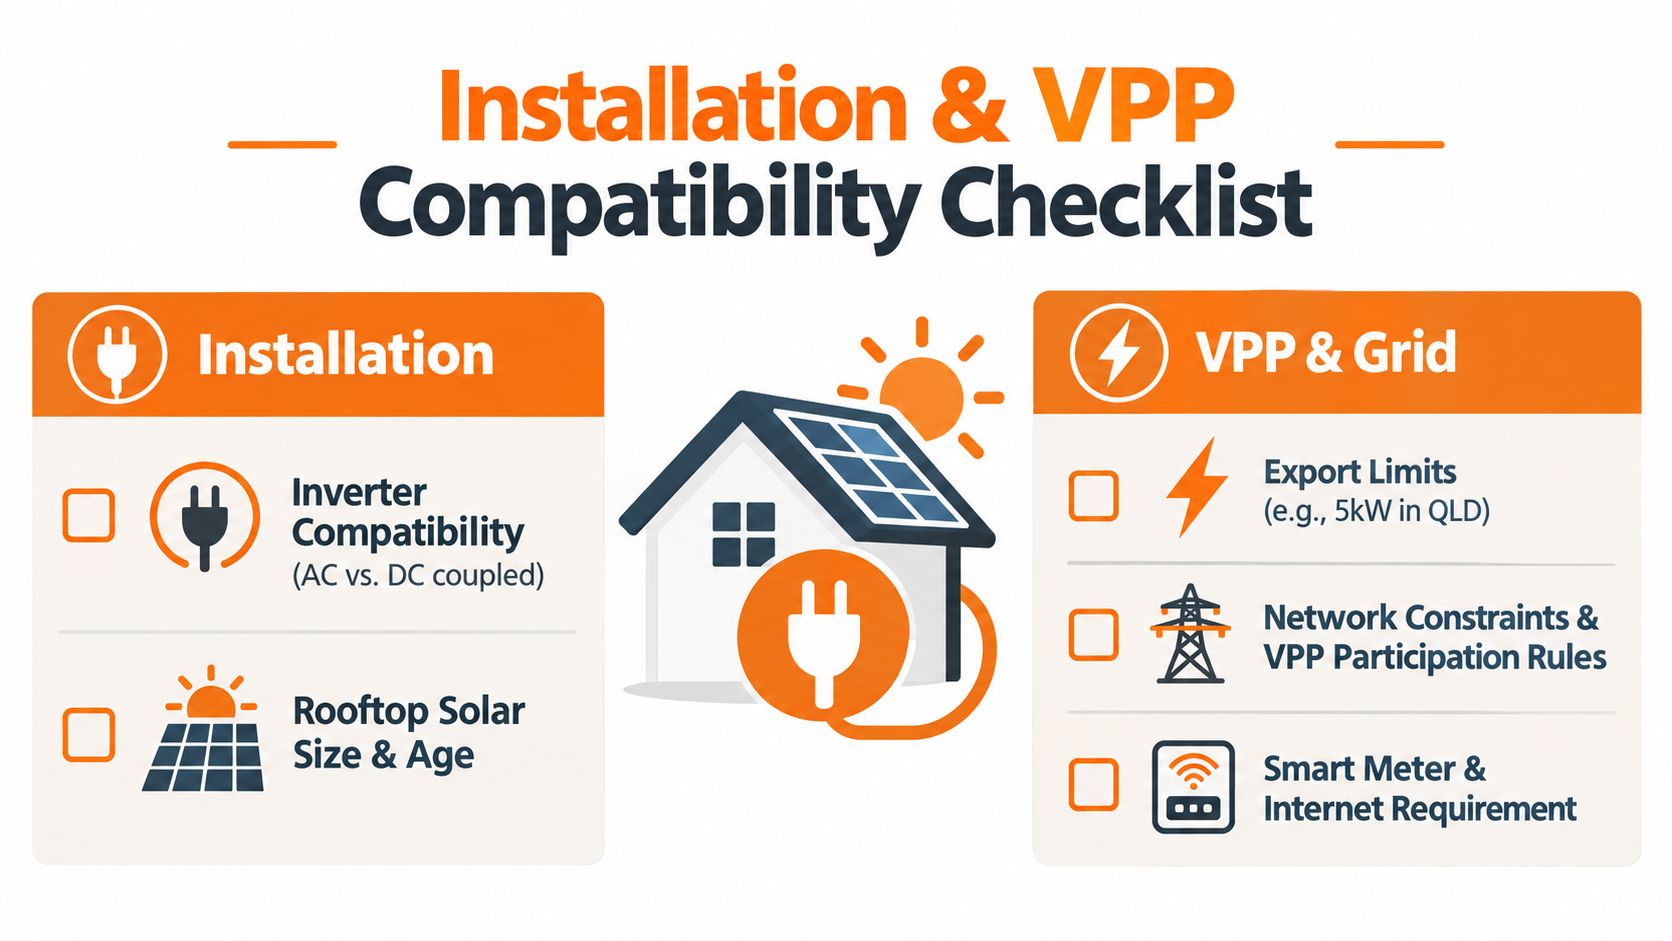
A battery's economic value depends partly on whether the site can use it effectively. Before commissioning, the installer should assess AC or DC coupling, inverter compatibility, switchboard capacity, metering, communications and the proposed control arrangement. These checks determine whether the battery can charge, discharge and join a VPP without avoidable constraints.
Network conditions shape available value
Export limits can reduce the energy a property sends to the grid. Queensland owners should confirm local export settings, inverter limits and network requirements with an accredited installer. New South Wales owners need the same assessment, particularly where local constraints influence export timing or volume during high-supply periods.
The National Electricity Market adds price and dispatch complexity. Retailers buy and sell electricity in conditions shaped by demand, available generation, congestion and wholesale volatility. A VPP coordinates many smaller batteries to respond to market or system conditions. That coordination may support grid stability, but dispatch remains subject to connection rules and household requirements.
Installation performance therefore depends on more than battery capacity. Reliable communications, a suitable smart meter where required, an approved control pathway and clear operating rules all affect participation. Queensland's higher temperatures also make equipment location, ventilation and thermal management relevant to lifetime performance.
Owners should review the site's system integration requirements before comparing VPP allowances. A technically incompatible system cannot capture the advertised value.
What a retailer-based BYOB VPP changes
A Bring Your Own Battery VPP, or BYOB VPP, connects an existing compatible battery to a retailer's control platform. The owner keeps the installed battery while the operator coordinates charging and discharging around household demand, network rules and available market opportunities.
HighFlow Energy operates an Australian retailer-based BYOB VPP for eligible solar and battery owners in Queensland and New South Wales. Its model uses existing compatible equipment, retains household access to stored energy and provides a monthly electricity allowance funded through coordinated grid services.
New South Wales also has a VPP incentive linked to the battery capacity made available to the grid, capped at 28 kWh, as described by NSW VPP guidance reported by CHOICE. That incentive should be assessed separately from a retailer's allowance, tariff structure and customer-control terms.
The commercial comparison is the allowance earned through extra dispatch versus the feed-in tariff forgone by storing or exporting energy differently. Owners should also check warranty treatment, cycling limits, reserve settings and exit conditions before assigning a value to VPP income.
Control matters as much as capacity: A VPP should state when it can dispatch the battery, how much reserve the household retains and how warranty conditions are protected.
Choosing the Best Home Battery for Your Household Scenario
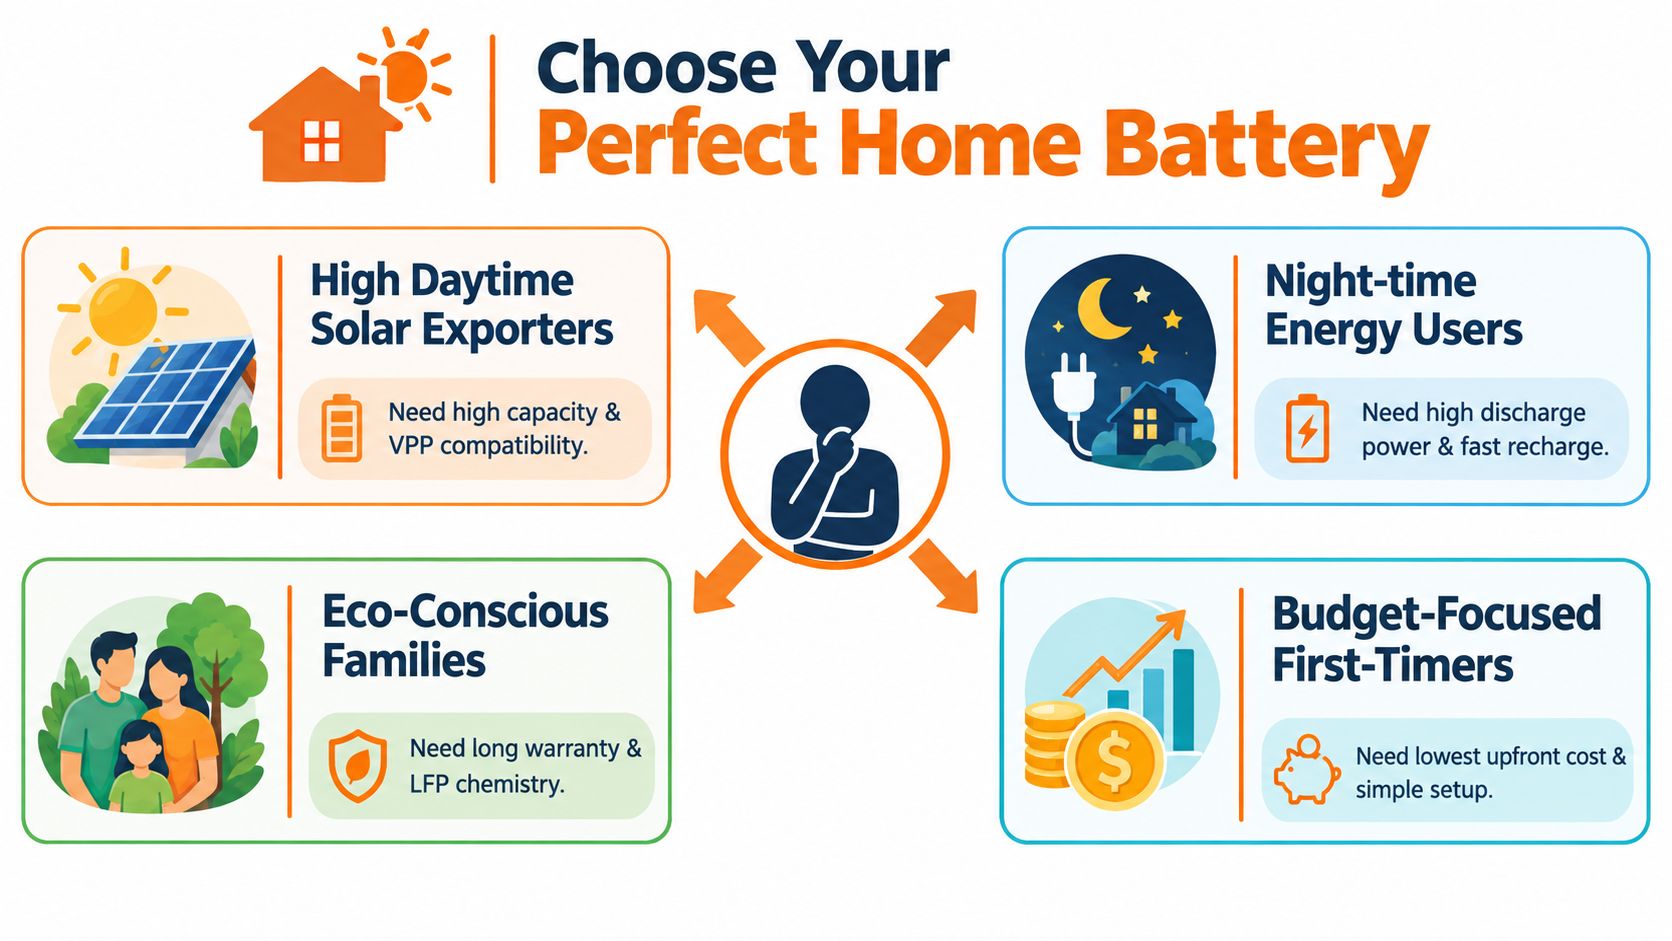
There isn't one universally best battery. The most appropriate system depends on whether the home exports heavily during the day, consumes electricity after sunset, needs scalable storage or wants to prioritise VPP participation.
Match the system to the household
| Household scenario | Prioritise | Main trade-off |
|---|---|---|
| High daytime solar exporter | Usable capacity, scalability and VPP compatibility | More capacity only pays when the home or grid can use it |
| Evening peak user | Discharge power and efficient cycling | High output may cost more than the household needs |
| Larger family or expanding load | Modular capacity and durable warranty terms | Expansion can increase capital cost and cycling exposure |
| VPP-focused owner | Compatible controls, reserve settings and transparent allowance | More dispatch can affect throughput and degradation |
A high daytime exporter may benefit from a system that can absorb surplus generation and participate in coordinated demand response. The owner should still check network export rules and ensure the battery won't be oversized relative to the energy available for charging.
An evening peak user may place greater weight on usable capacity and discharge power than on maximum stack size. A system that can deliver the required output at the right time may produce more practical value than one with a larger headline capacity that rarely fills.
Capacity is only valuable when the household can charge, discharge or monetise it under its actual operating limits.
A VPP-focused owner should compare the allowance structure with the value of a traditional feed-in tariff. A feed-in tariff rewards exported energy at the retailer's stated rate. A VPP may create value from coordinated dispatch during periods when the grid places a higher value on flexible capacity. The owner must compare the full terms, not assume that any VPP automatically produces a better outcome.
The SolarQuotes battery comparison resource provides additional Australian market context, while product selection should remain grounded in the home's interval data, solar generation, inverter compatibility and warranty requirements.
Key Takeaways and Next Steps for Battery Owners
A defensible home battery comparison should assess four layers:
- Technical performance: usable capacity, depth of discharge, round-trip efficiency and cycle life.
- System fit: inverter, meter, communications and network compatibility.
- Financial durability: payback after rebates, losses, degradation and warranty cycling limits.
- Operating value: self-consumption, feed-in returns and VPP participation.
Battery ownership and battery optimisation are separate decisions. ACCC-reported data cited by CHOICE's VPP bill analysis found that households with solar and batteries had annual bills 20% to 52% lower than grid-only households. The 24% participating in VPPs had bills 57% to 63% lower, with annual bills $762 to $1,093 lower than regular customers in financial year 2024–25.
Individual results will vary. The data does show why battery optimisation matters. Independent Australian reporting found only about 24% of battery owners participate in VPPs, while average dispatch was about 1.09 kWh per customer per day, indicating that much battery capacity remains underused for grid services. The Australian VPP participation analysis provides that context.
Before enrolling, customers should retain priority access to stored energy, understand reserve settings and confirm how extra cycling affects the warranty. Check eligibility, allowance terms, exit conditions and how electricity used above the allowance is treated. Compare the VPP allowance with the feed-in tariff return before assigning the battery to coordinated dispatch.
HighFlow Energy connects compatible existing solar and battery systems to a retailer-based BYOB VPP across Queensland and New South Wales. Visit HighFlow Energy to check eligibility and assess whether unused battery capacity could have greater financial value.